
Overview
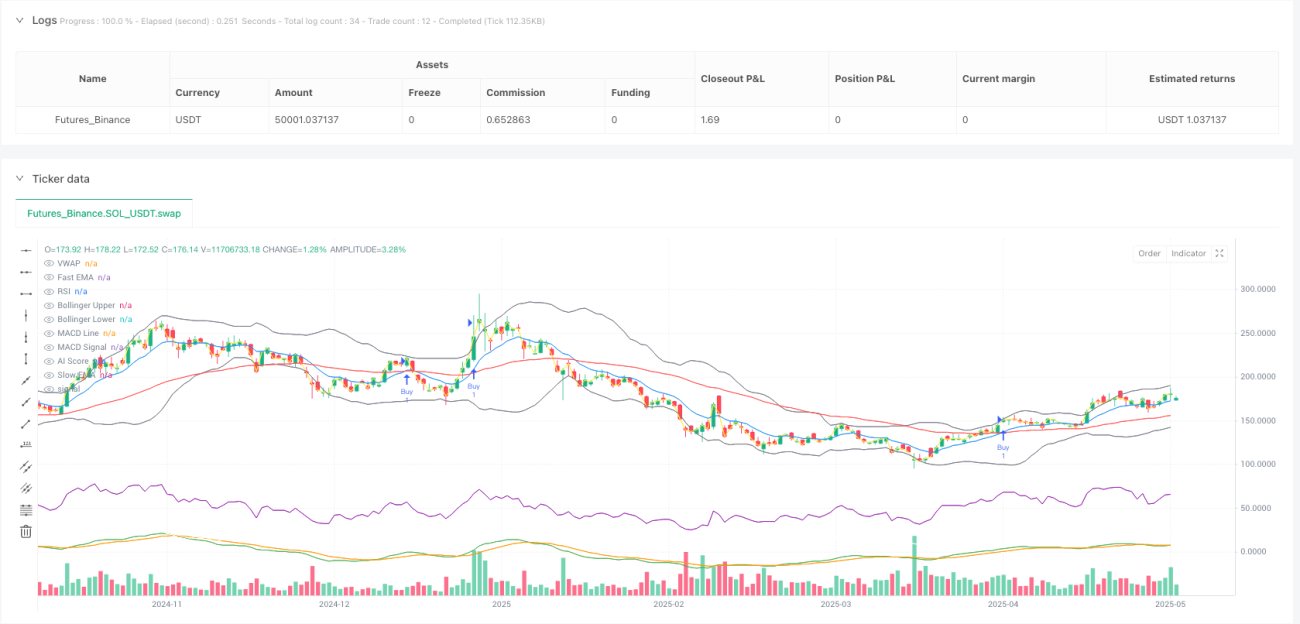
The AI-Driven Multi-Factor Quantitative Trading Strategy is a comprehensive trading system that combines momentum analysis, trend strength, and volatility indicators. This strategy integrates multiple technical indicators, including Exponential Moving Averages (EMA), Relative Strength Index (RSI), Moving Average Convergence Divergence (MACD), Bollinger Bands, and Volume Weighted Average Price (VWAP), to form an artificial intelligence scoring system for identifying high-probability trading opportunities. This approach not only determines market trend direction but also enhances the accuracy of trading signals through multi-layered confirmation mechanisms, providing traders with more reliable entry and exit points.
Strategy Principles
The core principle of this strategy is to identify trading opportunities through the collaborative effect of multiple technical indicators, building a comprehensive scoring system. Specifically, the strategy operates according to the following key steps:
-
Trend Identification: The strategy uses the crossover of fast EMA (10-period) and slow EMA (50-period) to determine market trend direction. When the fast EMA crosses above the slow EMA, a bullish signal is generated; conversely, when the fast EMA crosses below the slow EMA, a bearish signal is generated.
-
Momentum Confirmation: The RSI indicator (14-period) is used to assess market momentum. An RSI value greater than 50 indicates the market has upward momentum, supporting buy signals; an RSI value less than 50 indicates weakening market momentum, supporting sell signals.
-
Trend Strength Analysis: The MACD indicator (12,26,9 parameter settings) further confirms trend strength. The crossover of the MACD line with the signal line and the positive or negative state of the MACD value are used to verify the strength of market trends.
-
Volatility Analysis: Bollinger Bands (20-period, 2 standard deviations) are used to assess market volatility and potential reversal zones. Prices near the lower band may indicate oversold conditions, while prices near the upper band may indicate overbought conditions.
-
Institutional Activity Monitoring: The VWAP indicator assesses institutional trading activity. Prices above VWAP indicate strong demand; prices below VWAP indicate market weakness.
-
AI Scoring System: The most critical part of the strategy is integrating the above factors into a weighted scoring system:
- RSI factor weight: 30%
- MACD factor weight: 40%
- VWAP factor weight: 30%
When the AI score is greater than 0, it confirms a buy setup; when the AI score is less than 0, it confirms sell conditions.
-
Trade Execution Rules:
- Entry conditions: Enter when EMA crossover occurs and AI score supports
- Exit conditions: Exit when trend strength reverses
- Risk management: Set 0.5% stop loss and 1.5% take profit levels
From the code implementation, the strategy defines all necessary technical indicators in PineScript and creates trading signals through logical combinations. The strategy opens long positions when buy conditions are met, opens short positions when sell conditions are met, and sets corresponding stop loss and take profit levels for each trade.
Strategy Advantages
Through in-depth analysis of the code, this strategy demonstrates the following significant advantages:
-
Multi-layered Confirmation Mechanism: The strategy does not rely on a single indicator but uses multiple technical indicators for cross-validation, significantly reducing the risk of false signals. EMA crossovers provide trend direction, RSI confirms momentum, MACD verifies trend strength, Bollinger Bands assess volatility, and VWAP monitors institutional activity.
-
Comprehensive Consideration of Market Multi-dimensional Factors: The strategy integrates market data from four dimensions: trend, momentum, volatility, and institutional activity, providing a more comprehensive market perspective and adapting to different market environments.
-
AI Weighted Scoring System: By assigning different weights to different factors, the strategy can more intelligently assess market conditions. The MACD factor is given a 40% weight, emphasizing the importance of trend confirmation; RSI and VWAP each account for 30%, balancing consideration of momentum and institutional activity.
-
Clear Risk Management Rules: The strategy has built-in fixed proportion stop loss (0.5%) and take profit (1.5%), with take profit three times larger than stop loss, providing a positive expected value risk-reward ratio that contributes to long-term capital growth.
-
Strong Strategy Adaptability: Based on the code structure, this strategy can be applied to different time periods and market environments, suitable for market making, swing trading, and long-term investment, among other trading styles.
-
Clear and Concise Logic: Despite integrating multiple indicators, the strategy logic is clear, and trading rules are intuitive, easy to understand and execute, reducing operational difficulty.
-
Visualization Support: The strategy code includes plotting functions for various indicators, allowing traders to intuitively observe indicator changes and trading signals, facilitating backtesting analysis and real-time monitoring.
Strategy Risks
Despite its many advantages, this strategy still has the following potential risks:
-
Market Oscillation Risk: In sideways or oscillating markets, frequent EMA crossovers may lead to multiple false signals, producing a "sawtooth effect" that increases trading costs and may result in consecutive losses. Solution: Add trend filters or adjust EMA periods to reduce signal frequency in oscillating markets.
-
Fixed Stop Loss Risk: The strategy uses a fixed percentage stop loss (0.5%), without considering the asset's volatility characteristics and market structure. In highly volatile markets, this stop loss setting may be too small, leading to frequent triggering. Solution: Dynamically adjust stop loss levels based on ATR (Average True Range) to adapt to current market volatility.
-
Insufficient Weight Optimization: The weight allocation in the AI scoring system (30%, 40%, 30%) is fixed and not optimized for different market environments or asset classes. Solution: Calibrate optimal weights for different market environments through historical backtesting data, or even consider using machine learning methods to dynamically adjust weights.
-
Lack of Volume Confirmation: Although the strategy uses VWAP, it does not directly consider volume changes, which may produce unreliable signals in low liquidity environments. Solution: Add volume filters to ensure trades are executed only when supported by sufficient volume.
-
Drawdown Risk: The fixed 1.5% take profit may lead to premature exit from strong trends, missing greater profit opportunities. Solution: Consider implementing trailing stops or partial profit-taking strategies to allow profitable trades more room for profit.
-
Correlation Risk: Multiple indicators used in the strategy (such as EMA, RSI, and MACD) may be highly correlated under certain market conditions, weakening the value of multiple confirmations. Solution: Consider introducing indicators with stronger non-correlation, such as volatility indicators or market fundamental data.
-
Overfitting Risk: Complex multi-factor models are more prone to overfitting historical data, potentially performing poorly in future market environments. Solution: Conduct rigorous forward testing and out-of-sample testing to ensure strategy robustness.
Strategy Optimization Directions
Based on the above analysis, this strategy can be optimized in the following directions:
-
Dynamic Parameter Adjustment: Currently, the strategy uses fixed parameter settings (such as EMA 10/50, RSI 14, etc.). A parameter adaptive mechanism could be implemented to automatically adjust indicator parameters based on market volatility, improving the strategy's adaptability to different market environments. The reason for doing this is that different market environments (trending, oscillating, high volatility, etc.) require different parameter settings to achieve optimal results.
-
Intelligent Weight Allocation: The current AI scoring system uses fixed weights (30%, 40%, 30%). Machine learning algorithms could be introduced to dynamically adjust factor weights, or different weight configurations could be preset for different asset classes and market environments. This would allow the strategy to better adapt to market changes and improve the accuracy of the scoring system.
-
Enhanced Risk Management: Replace fixed proportion stop loss and take profit with an ATR-based dynamic risk management system, and consider implementing trailing stop mechanisms. This would adjust risk control parameters according to actual market volatility, both protecting capital safety and avoiding premature exit from strong trends.
-
Market Environment Filtering: Add a market environment recognition module to distinguish between trending and oscillating markets, and apply different trading rules in different market environments. This would avoid frequent trading in market environments unsuitable for the strategy, improving overall win rates.
-
Time Filter: Add time filtering functionality to avoid abnormal volatility periods (such as market opening, important economic data release times, etc.). This would avoid trading during periods of greater market noise, reducing false signals.
-
Enhanced Volume Analysis: Deepen the analysis of volume data, adding abnormal volume detection and liquidity assessment functions. This would ensure trades are only conducted with sufficient liquidity support, improving trade execution quality.
-
Correlation Filtering: Introduce indicator correlation analysis, adjusting weights or temporarily disabling certain indicators when core indicators are highly correlated. This would avoid the problem of multiple confirmation mechanisms failing due to indicator correlation, maintaining signal independence and reliability.
-
Fractal Analysis Integration: Consider introducing fractal theory or multi-timeframe analysis to ensure trades are consistent with trends in larger time periods. This would improve trade success rates and avoid operating against major trends.
Summary
The AI-Driven Multi-Factor Quantitative Trading Strategy is a comprehensive trading solution that combines multiple technical indicators and an artificial intelligence scoring system. By integrating trend identification (EMA), momentum analysis (RSI), trend strength assessment (MACD), volatility analysis (Bollinger Bands), and institutional activity monitoring (VWAP), this strategy can provide more reliable trading signals.
The core advantages of the strategy lie in its multi-layered confirmation mechanism and weighted scoring system, which can more comprehensively assess market conditions by assigning appropriate weights to different factors. The built-in risk management rules provide clear stop loss and take profit guidance, helping to protect capital safety.
However, the strategy also has potential issues such as fixed parameter settings, market oscillation risk, and possible overfitting. By implementing dynamic parameter adjustment, intelligent weight allocation, enhanced risk management, and market environment filtering, among other optimization measures, the strategy's robustness and adaptability can be further improved.
Overall, this is a quantitative trading strategy with clear logic and a well-developed structure, suitable for application in various market environments. Through continuous optimization and adjustment, this strategy has the potential to become a powerful weapon in a trader's toolkit, providing support for long-term stable trading performance.
- 1