
Overview
The Trend Reversal Hammer Pattern with EMA Confirmation Trading Strategy is a quantitative trading system that combines the classic hammer pattern from technical analysis with the Exponential Moving Average (EMA). This strategy primarily identifies potential market reversal points using hammer and inverted hammer formations as trading signals, while incorporating the EMA50 as a trend confirmation tool to enhance trading accuracy. The strategy also features built-in stop-loss and take-profit mechanisms based on minimum price movement units (Ticks) to control risk and secure profits. This combined approach aims to capture market turning points while providing clear entry and exit rules.
Strategy Principles
The core principles of this strategy revolve around several key elements:
-
Hammer Pattern Identification:
- Bullish Hammer: Lower wick length is greater than twice the body length, upper wick length is less than half the body length, and occurs in a downtrend (current close lower than previous bar, which is lower than the bar before).
- Bearish Inverted Hammer: Upper wick length is greater than twice the body length, lower wick length is less than half the body length, and occurs in an uptrend (current close higher than previous bar, which is higher than the bar before).
-
EMA Trend Confirmation:
- Uses a 50-period Exponential Moving Average (EMA50) as a trend indicator.
- Long Signal: Hammer pattern detected and close price above EMA50.
- Short Signal: Inverted hammer pattern detected and close price below EMA50.
-
Tick-Based Risk Management:
- Stop Loss Setting: Based on multiples of the market's minimum price movement (Tick), default is 1 Tick.
- Take Profit Setting: Also based on Tick multiples, default is 10 Ticks.
- Long Trades: Entry price minus stop loss Ticks as stop loss point, entry price plus take profit Ticks as take profit point.
- Short Trades: Entry price plus stop loss Ticks as stop loss point, entry price minus take profit Ticks as take profit point.
Strategy Advantages
-
Clear Market Reversal Signals: By identifying specific candlestick patterns (hammer and inverted hammer), the strategy can capture potential market reversal points, as these formations are widely considered powerful reversal signals in technical analysis.
-
Multiple Confirmation Mechanisms: The strategy relies not only on pattern recognition but also combines trend context (direction of the previous two candles) and EMA50 position as confirmation, significantly reducing the risk of false signals.
-
Precise Risk Management: Tick-based stop loss and take profit settings provide accurate risk control, allowing traders to adjust risk parameters according to the volatility characteristics of different markets.
-
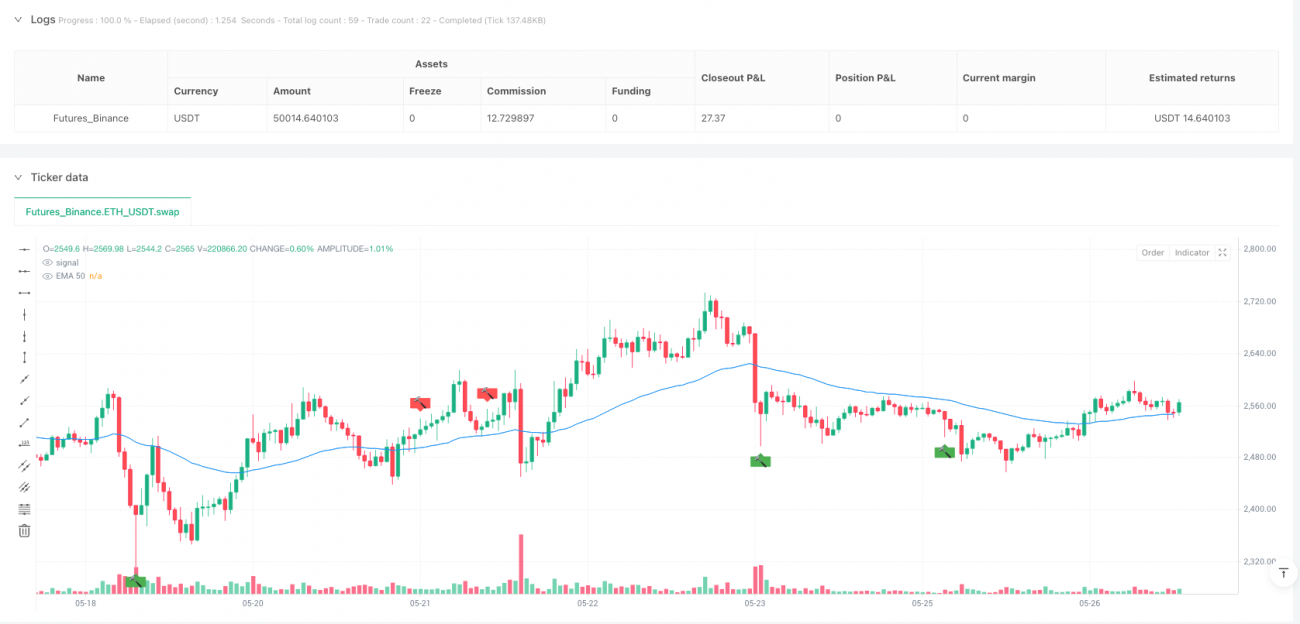
Visualized Trading Signals: The strategy visually marks hammer and inverted hammer patterns on the chart, using emoji labels (🔨) to enhance recognition, making it convenient for traders to monitor and analyze in real-time.
-
High Adaptability: Through parameterized EMA periods and risk settings, the strategy can be flexibly adjusted according to different market environments and trader risk preferences.
Strategy Risks
-
Limitations of Pattern Recognition: Hammer and inverted hammer pattern recognition may generate too many signals in highly volatile markets or miss important reversal points in low volatility markets. To address this risk, consider adding additional filtering conditions such as volatility indicators or volume confirmation.
-
Fixed Tick Stop Loss Risk: Using a fixed number of Ticks for stop loss may not be suitable for all market conditions, especially when volatility suddenly increases. It is recommended to dynamically adjust the stop loss size based on the Average True Range (ATR) of the market.
-
EMA Lag: EMA50 as a trend confirmation tool has a certain lag, which may cause missing the optimal entry point when the market changes drastically. Consider combining short-term moving averages or momentum indicators to improve sensitivity to market changes.
-
Counter-Trend Trading Risk: This strategy is essentially a counter-trend strategy, attempting to capture market reversal points, which inherently carries higher risk. It is recommended to control position size and avoid excessive leverage when applying this strategy.
-
Parameter Sensitivity: The effectiveness of the strategy is highly dependent on EMA length and stop loss/take profit settings. Different markets and timeframes may require different parameter combinations, which need to be found through backtesting.
Strategy Optimization Directions
-
Add Volume Confirmation: Volume can be added as a confirmation condition on the basis of pattern recognition, for example, requiring the hammer pattern to be accompanied by above-average trading volume to enhance signal reliability.
-
Dynamic Risk Management: Change the fixed Tick stop loss/take profit mechanism to a dynamic mechanism based on ATR (Average True Range) to better adapt to changes in market volatility. For example, stop loss can be set as a certain percentage of the current ATR.
-
Multi-Timeframe Analysis: Introduce multi-timeframe analysis, such as requiring the trend direction of a higher timeframe to be consistent with the trading direction, to reduce the risk of trading against the major trend.
-
Add Filtering Conditions: Other technical indicators can be added as filters, such as RSI (Relative Strength Index) or MACD (Moving Average Convergence Divergence), executing trades only when these indicators also show overbought or oversold conditions.
-
Optimize EMA Period: Find the optimal EMA period through backtesting for different markets and timeframes, rather than fixing it at 50 periods. Some markets may respond better to shorter (e.g., 20) or longer (e.g., 100) EMA periods.
-
Add Profit Protection Mechanism: Implement a trailing stop loss function that moves the stop loss point to lock in partial profits when the price moves a certain distance in the favorable direction, preventing loss of existing profits due to market reversal.
Conclusion
The Trend Reversal Hammer Pattern with EMA Confirmation Trading Strategy is a comprehensive trading system combining classic technical analysis patterns with trend confirmation tools. By identifying hammer and inverted hammer patterns, two powerful reversal signals, and using EMA50 as a trend filter, the strategy can effectively capture potential market turning points. The built-in Tick-based risk management mechanism provides precise stop loss and take profit settings, helping traders control risk and secure profits.
Although the strategy provides clear entry and exit rules, it still faces challenges such as pattern recognition limitations, fixed stop loss risks, and EMA lag. By adding volume confirmation, implementing dynamic risk management, introducing multi-timeframe analysis, and adding other technical indicators as filters, the robustness and adaptability of the strategy can be significantly improved.
Ultimately, successful application of this strategy depends on the trader's correct adjustment of parameters and deep understanding of market characteristics. Through comprehensive backtesting and continuous optimization, the Trend Reversal Hammer Pattern with EMA Confirmation Trading Strategy can become a powerful tool for capturing market reversal opportunities.
- 1