
Strategy Overview
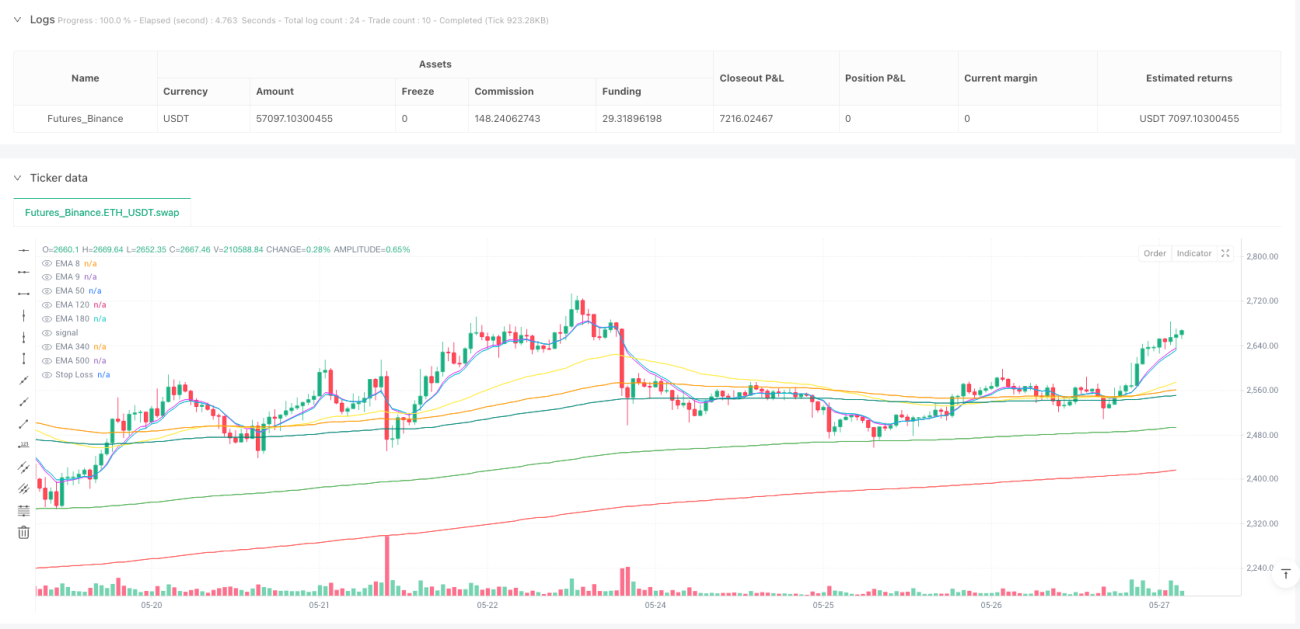
The Multi-Cloud Tier Trend Following Strategy is a trading system based on multiple Exponential Moving Averages (EMAs) that constructs four different "cloud layers" to identify market trends and determine entry timing. The core concept is to enter the market in the early stages of a new trend through moving average crossover signals and protect profits using a dynamic stop-loss mechanism. The strategy employs a multi-tiered trend confirmation mechanism, using long-term EMAs (340 and 500) to determine the primary trend direction, medium-term EMAs (50 and 120) to identify trend transition points, and short-term EMAs (8 and 9) for precise exit timing.
Strategy Principles
The strategy operates based on the following key elements:
-
Trend Identification System:
- Cloud 4 (Long-term trend): Determines the major trend direction through the relative position of EMA340 and EMA500
- Cloud 3 (Medium-term trend): Monitors crossovers between EMA50 and EMA120
- Valid Zone Assessment: Filters effective crossover signals through specific conditions (such as EMA180<EMA500 or EMA50 within a specific range)
-
Entry Conditions:
- Long Entry: When Cloud 4 is up (EMA340>EMA500) and Cloud 3 shows an upward crossover (EMA50 crosses above EMA120), while meeting valid zone conditions
- Short Entry: When Cloud 4 is down (EMA340<EMA500) and Cloud 3 shows a downward crossover (EMA50 crosses below EMA120), while meeting valid zone conditions
-
Risk Management and Exit Mechanism:
- Initial Phase: Uses a fixed percentage stop-loss (default 1%)
- After holding for a certain period (default 20 candles): Switches to dynamic trailing stop-loss
- Advanced Stop-Loss Transition: When price remains above (long) or below (short) EMA8 for 15 consecutive candles, the stop-loss line upgrades to EMA9, otherwise uses EMA500
- Unidirectional Position: Only allows one trade direction at a time
-
Trade State Management:
- Tracks entry price, stop-loss level, days in position, and other variables
- Only closes positions when stop-loss is triggered, not exiting prematurely due to new signals
Strategy Advantages
Through deep analysis of the strategy code, the following significant advantages can be summarized:
-
Multiple Confirmation Mechanism: Uses combinations of EMA crossovers from different periods, reducing the risk of false breakouts. By requiring consistency between long-term and medium-term trend directions, signal quality is greatly improved.
-
Early Trend Capture: The strategy focuses on entering at the beginning of trend formation rather than in the middle or late stages, increasing potential profit space. Particularly through the designed valid zone assessment, it can filter out more promising entry points.
-
Dynamic Risk Management: Initially uses fixed stop-loss to protect capital, then transitions to trailing stop-loss to lock in profits, demonstrating a comprehensive risk control approach. Especially when the trend is strong (price remains above/below EMA8 for 15 consecutive candles), it upgrades to the tighter EMA9 stop-loss, improving capital efficiency.
-
Trend Continuity Optimization: The strategy doesn't immediately exit when reverse signals appear, but relies on the stop-loss mechanism to manage risk, fully respecting trend continuity and avoiding premature exits from strong trends.
-
Strong Parameter Adjustability: Key parameters such as EMA periods, stop-loss percentage, and trailing stop-loss activation time can all be optimized and adjusted according to different market environments and trading instruments.
Strategy Risks
Despite its sophisticated design, the strategy still has the following potential risks:
-
Poor Performance in Ranging Markets: As a trend-following strategy, it tends to generate frequent false signals in sideways, choppy markets, leading to consecutive stop-losses. The solution is to add trend strength filtering conditions or pause trading when ranging markets are identified.
-
Lag Risk: All systems based on moving averages have a certain lag, which may lead to untimely entries or exits near trend turning points. This can be mitigated by introducing momentum indicators or volatility indicators as auxiliary judgments.
-
Parameter Sensitivity: The strategy uses multiple EMA period parameters, and excessive optimization may lead to curve-fitting issues. It is recommended to validate parameter robustness through backtesting across different time periods to avoid overfitting to specific market environments.
-
Gap Risk: Significant market gaps may cause stop-losses to fail, with actual stop prices far lower (for longs) or higher (for shorts) than expected levels. Consider using options hedging or setting maximum acceptable loss limits.
-
Capital Management Defects: The strategy defaults to using 100% of account funds for trading, without adjusting position size according to volatility, potentially facing excessive risk in highly volatile markets. It is recommended to introduce dynamic position sizing based on ATR or volatility.
Strategy Optimization Directions
Based on in-depth analysis of the code, the strategy can be optimized in the following directions:
-
Trend Strength Filtering: Introduce ADX or similar indicators to evaluate trend strength, only entering when trends are clear, avoiding false signals in ranging markets. This optimization can significantly improve signal quality, as the current strategy relies only on EMA relative positions to judge trends, lacking assessment of trend strength.
-
Dynamic Position Sizing: Adjust the percentage of funds for each trade based on ATR or historical volatility, reducing positions in high-volatility markets and increasing positions in low-volatility markets. This can balance risk-reward ratios and improve the smoothness of the equity curve.
-
Time Filtering: Add trading time window filters to avoid low liquidity or high volatility periods. Especially for certain trading instruments, there may be specific time periods when trading effects are significantly better.
-
Stop-Loss Optimization: The current strategy jumps directly from EMA500 to EMA9 as the stop-loss line when conditions are met, which may be too aggressive. Consider designing a smoother stop-loss line switching mechanism, such as dynamically adjusting the stop-loss line position based on the distance ratio between price and different EMAs.
-
Reversal Signal Handling: When strong reversal signals appear (such as Cloud 4 direction change), consider closing positions early and opening reverse positions, rather than waiting for stop-losses to trigger. This allows for faster position direction adjustment when major trends change.
-
Multi-Timeframe Analysis: Introduce higher timeframe trend judgments as additional filtering conditions, only entering when trends align across multiple timeframes, improving signal quality.
Conclusion
The Multi-Cloud Tier Trend Following Strategy is an elegantly designed trend following system that confirms trend direction through multi-level EMA crossovers and enters in the early stages of trends, combining dynamic stop-loss mechanisms to manage risk and protect profits. The strategy's greatest advantages lie in its multiple confirmation mechanisms and intelligent stop-loss management, allowing it to perform well in trending markets.
However, the strategy may not perform well in ranging markets and has inherent flaws such as parameter sensitivity and lag. By introducing trend strength filtering, dynamic position sizing, multi-timeframe analysis, and other optimization measures, the strategy's robustness and adaptability can be further enhanced.
Overall, this is a clearly structured, logically rigorous trend following strategy suitable for medium to long-term traders in clearly trending market environments. With appropriate parameter adjustments and optimizations, this strategy has the potential to become a reliable trading system component.
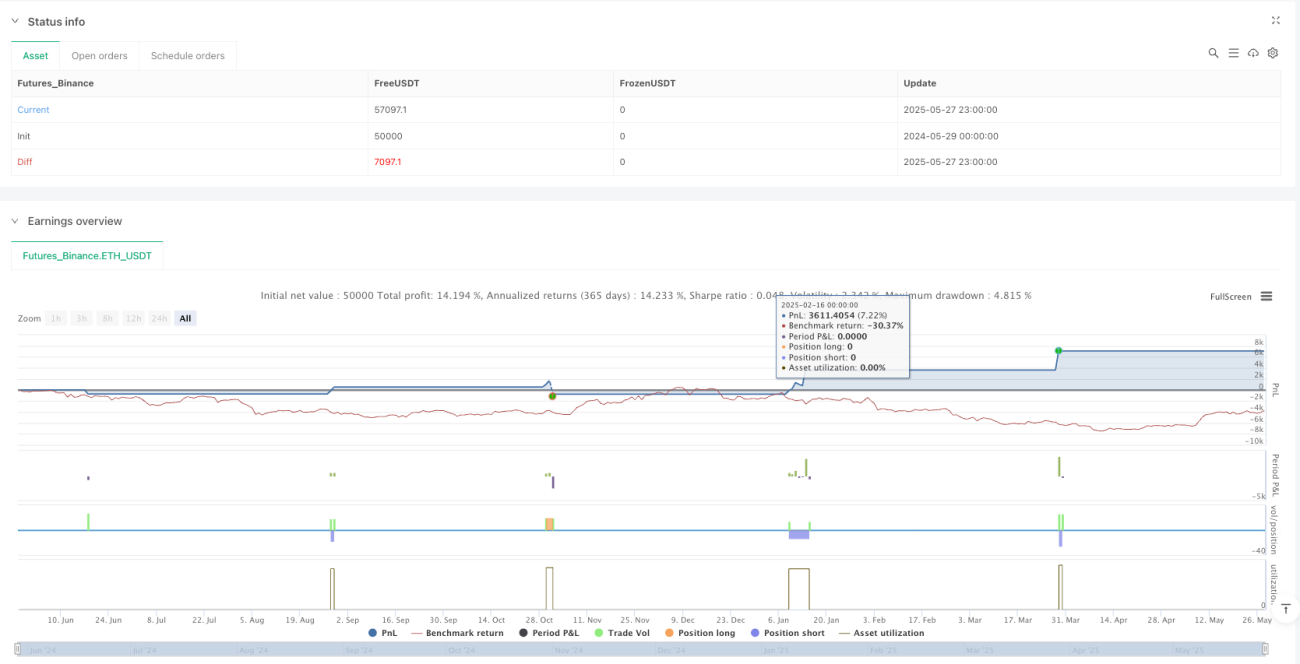
/*backtest
start: 2024-05-29 00:00:00
end: 2025-05-28 00:00:00
period: 1h
basePeriod: 1h
exchanges: [{"eid":"Futures_Binance","currency":"ETH_USDT"}]
*/

//@version=5
strategy("Ripster Cloud Trend Strategy - Parameterstyrd", overlay=true, default_qty_type=strategy.percent_of_equity, default_qty_value=100)

// === 🔧 Inputs ===- 1