
Strategy Overview
This strategy is a short-term high-frequency quantitative trading approach designed specifically for 5-minute charts, combining Exponential Moving Average (EMA) crossover signals with pivot-based support and resistance zones to identify potential trading opportunities. The strategy is particularly suitable for scalpers who seek quick trades completed within short timeframes. The core components include a fast and slow EMA crossover system, automatically detected support and resistance zones, and preset risk management parameters, aimed at capturing short-term market fluctuations while strictly controlling risk.
Strategy Principles
The operational principles of this strategy are based on several key technical elements:
-
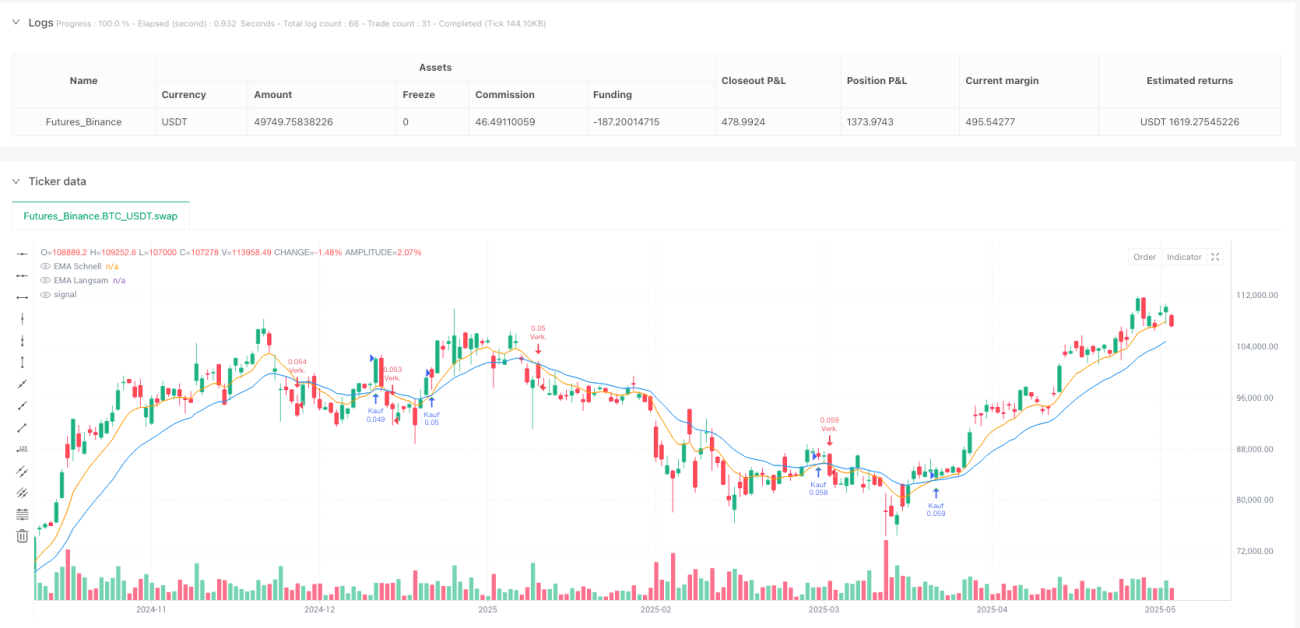
EMA Crossover Signal System: The strategy utilizes two exponential moving averages with different periods - a fast EMA (default: 9 periods) and a slow EMA (default: 21 periods). A long signal is generated when the fast EMA crosses above the slow EMA; a short signal is generated when the fast EMA crosses below the slow EMA. This crossing behavior typically indicates a change in market momentum, potentially signaling the formation of a short-term trend.
-
Support and Resistance Zone Identification: The strategy automatically identifies important price levels by detecting pivot highs and pivot lows (default: 10 bars). These levels are marked as resistance zones (red horizontal lines) and support zones (green horizontal lines), with a maximum display of 5 S/R lines, helping traders understand market structure and potential reversal points.
-
Automated Risk Management: Each trading position is set with a percentage-based stop loss (default: 0.5%) and take profit (default: 1.0%), ensuring a risk-reward ratio of 1:2. These preset risk parameters help maintain long-term stable profitability.
-
Position Management: The strategy defaults to using 10% of the account value as position size for each trade, which can be adjusted according to individual risk preferences.
In code implementation, the strategy first calculates the two EMA lines, then identifies pivot points, and maintains two arrays to store support and resistance lines. When pivot highs or lows are detected, corresponding S/R lines are drawn through a custom function. Simultaneously, the strategy monitors EMA crossover events and triggers entry signals when crossovers occur, while setting appropriate stop loss and take profit levels.
Strategy Advantages
Through in-depth code analysis, this strategy demonstrates the following significant advantages:
-
Efficient Market Timing: The EMA crossover signal system effectively captures short-term market momentum changes, particularly suitable for rapid fluctuations on 5-minute charts.
-
Structured Market Analysis: Automatically generated support and resistance zones provide a clear view of market structure, helping traders understand at which levels prices may encounter resistance or find support, thereby optimizing entry and exit points.
-
Strict Risk Control: The built-in stop loss and take profit mechanisms ensure that each trade has predefined risk parameters, effectively limiting the maximum loss per trade and automatically securing profits when the expected profit target is reached.
-
Visualized Trading Signals: The strategy provides intuitive visual feedback through colored EMA lines (orange=fast, blue=slow) and signal arrows (green=long, red=short), making trading decisions clearer.
-
High Adaptability: Through adjustments of EMA periods, pivot lengths, risk parameters, and other input variables, the strategy can adapt to different market environments and personal trading styles.
-
Operational Simplicity: Once set up, the strategy can automatically identify signals and execute trades, reducing emotional interference and subjective judgment errors.
Strategy Risks
Despite its reasonable design, the strategy still has the following potential risks:
-
False Breakout Risk: In sideways or low-volatility markets, EMAs may cross frequently, leading to numerous false signals and unnecessary trades, increasing trading costs and potentially causing consecutive losses. The solution is to add additional confirmation indicators, such as volume or volatility filters, or suspend strategy operation when market trends are evidently insufficient.
-
Narrow Stop Loss Risk: The default 0.5% stop loss may be too tight in certain high-volatility markets, easily triggered by normal market noise. It is recommended to dynamically adjust stop loss levels based on the Average True Range (ATR) of the trading instrument, rather than using a fixed percentage.
-
Trend Reversal Risk: In strong trending markets, support and resistance zones may fail, and EMA crossover signals may come too late to effectively capture trend reversal points. Consider adding trend strength indicators to adjust trading direction preferences in strong trend environments.
-
Parameter Optimization Risk: Excessive parameter optimization may cause the strategy to perform well on historical data but poorly in live trading. It is recommended to use sufficiently long historical data and forward testing to verify parameter robustness.
-
Position Risk: Fixed use of 10% of account funds may be too aggressive in certain situations. Consider implementing a dynamic position management system, adjusting position size based on market volatility and recent strategy performance.
Strategy Optimization Directions
Based on code analysis, the strategy can be optimized in the following directions:
-
Add Market Environment Filters: The current strategy generates signals under any market conditions. A market environment recognition mechanism can be added, such as volatility-based filters or trend strength indicators, to trade only in suitable market environments. This is because EMA crossover strategies typically perform best in trending markets and tend to produce false signals in range-bound markets.
-
Dynamic Stop Loss Mechanism: Replace fixed percentage stop losses with ATR-based dynamic stop losses, making risk management more adaptable to current market volatility conditions. This allows for tighter stops in low-volatility periods and wider stops in high-volatility periods, better aligning with actual market conditions.
-
Add Volume Confirmation: Add volume confirmation requirements to EMA crossover signals, executing trades only when crossovers are accompanied by significant volume increases. This helps filter out low-quality crossover signals and improves trade success rates.
-
Consider Adding Trailing Stops: Automatically adjust stop loss positions after the price moves a certain distance in a favorable direction to protect existing profits. This trailing stop mechanism can maximize profit potential for each successful trade while maintaining a high risk-reward ratio.
-
Support and Resistance Zone Strength Assessment: Currently, all support and resistance zones are viewed as equally important. The strength of each zone can be evaluated based on the frequency and magnitude of price reversals in that area historically, and visualized using different line widths or colors. This can help traders identify the most critical price levels.
-
Time Filters: Add trading time filters to avoid volatile but directionless market opening and closing periods. Many markets exhibit more orderly price behavior during specific time periods; optimizing the strategy for these periods may improve overall performance.
Conclusion
The EMA Crossover and Support/Resistance Zone Integration for Short-Term High-Frequency Quantitative Trading Strategy is a carefully designed trading system that provides scalpers with a systematic trading method by combining classical indicators from technical analysis with modern risk management concepts. The core advantages of the strategy lie in its clear signal generation mechanism, transparent market structure visualization, and strict risk control system.
However, no trading strategy is infallible; this strategy may face challenges such as false signals and narrow stop losses in certain market environments. Through the introduction of market environment filters, dynamic stop loss mechanisms, and additional confirmation indicators, the strategy can be significantly optimized, improving its adaptability and robustness across different market conditions.
Most importantly, traders using this strategy should understand its underlying logic and limitations, conduct thorough backtesting and forward testing, and make appropriate parameter adjustments based on personal risk tolerance and market experience. Only by combining the strategy with personal trading style and market understanding can its maximum value be truly realized.
/*backtest
start: 2024-05-30 00:00:00
end: 2025-05-29 00:00:00
period: 1d
basePeriod: 1d
exchanges: [{"eid":"Futures_Binance","currency":"BTC_USDT"}]
*/

//@version=5
strategy("5m Scalping mit EMA Cross & S/R Zonen", overlay=true, default_qty_type=strategy.percent_of_equity, default_qty_value=10)

// === Inputs- 1