
Overview
The Multi-Level Take Profit Strategy with Support/Resistance and EMA Trend Filtering System is a trading strategy that combines technical analysis elements of support and resistance levels with moving average trend identification. The strategy primarily identifies buy signals near key support levels and sell signals near resistance levels, while using EMA (Exponential Moving Average) crossovers to confirm the overall market trend direction, thereby filtering out signals that don't align with the major trend. The strategy also implements three-tiered take-profit targets and stop-loss points, achieving a balance between risk management and profit maximization.
Strategy Principle
The core principle of this strategy is based on price rebounds and pullbacks near support and resistance levels, combined with EMA indicators to determine the overall market trend direction. Specifically:
- Support and Resistance Identification: The strategy defines clear support and resistance level parameters and detects whether the price is fluctuating within 1% range of these key price levels.
- Trend Confirmation Mechanism: Uses the relative position of fast EMA (default 50-period) and slow EMA (default 200-period) to determine market trends. When EMA50 is above EMA200, it's considered a bullish trend; otherwise, it's a bearish trend.
- Entry Condition Combination:
- Long Entry: Price near support level (±1%) and in a bullish trend (EMA50 > EMA200)
- Short Entry: Price near resistance level (±1%) and in a bearish trend (EMA50 < EMA200)
- Multi-Level Profit Mechanism: The strategy sets three profit targets at 1.05x (+5%), 1.10x (+10%), and 1.20x (+20%) of the entry price, capturing profits incrementally.
- Stop-Loss Protection: Sets a stop-loss at 0.97x (-3%) of the entry price to control maximum loss per trade.
Strategy Advantages
- Trend and Reversal Combination: The strategy cleverly combines the advantages of trend following (EMA indicator) and reversal trading (support/resistance), capturing trading opportunities at key price levels in the direction of the major trend.
- Multi-Level Profit Optimization: By employing three-tiered profit targets, traders can capture more profit as price continues to move favorably, while also securing partial profits when price makes only small favorable movements.
- Clear Risk Control: Through precise stop-loss settings, the maximum risk per trade is limited to approximately 3%, which aids in long-term capital management.
- High Adaptability: Strategy parameters (support/resistance levels, EMA periods, profit ratios, etc.) can all be customized, allowing traders to adjust the strategy according to different market environments.
- Clear Signals: Entry conditions are explicit, avoiding subjective judgment and improving trading discipline.
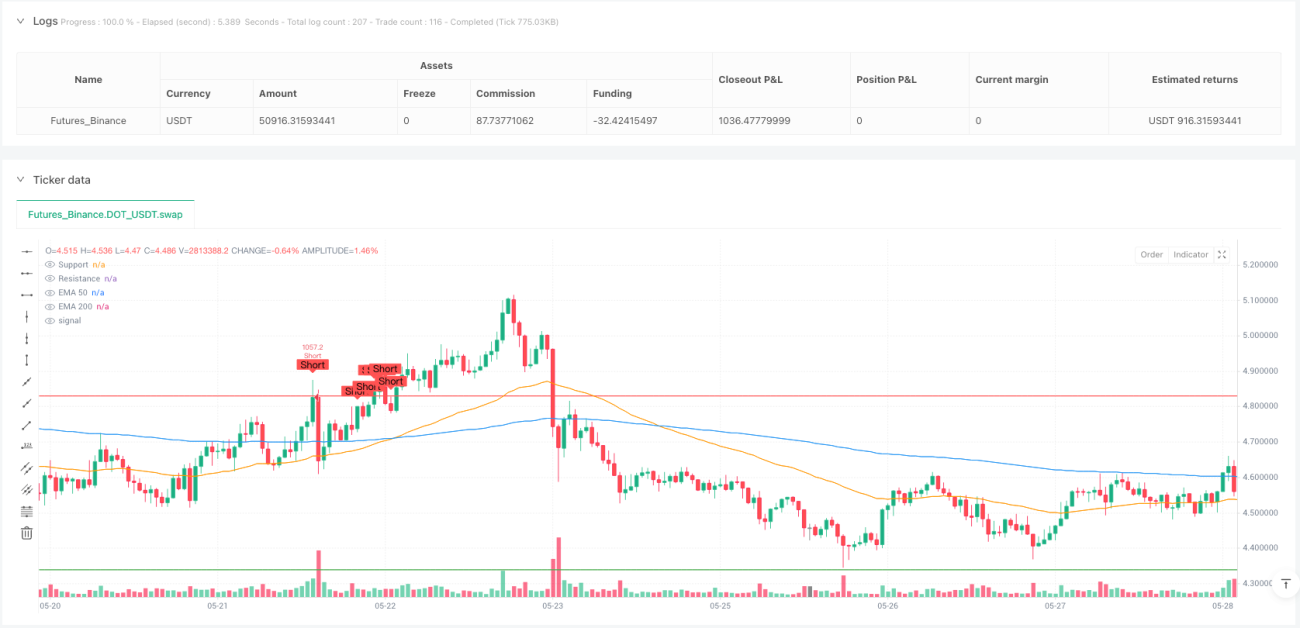
- Visual Assistance: The strategy plots support/resistance levels, EMA lines, and entry signal markers on the chart, helping traders intuitively understand market conditions.
Strategy Risks
- False Breakout Risk: Prices may briefly approach support/resistance levels and then quickly reverse, creating "false signals." In such cases, stop-losses will be triggered, resulting in small losses.
- Parameter Optimization Dependency: Support and resistance levels need to be updated periodically to adapt to market changes; fixed parameters may lead to declining strategy performance over time.
- EMA Lag: As a lagging indicator, EMA may not promptly reflect market trend changes, especially during rapid market fluctuations, potentially generating incorrect signals.
- Fixed Profit Targets: The strategy uses fixed percentages as profit targets, unable to automatically adjust according to market volatility. In highly volatile environments, it may secure profits too early, while in low volatility environments, profit targets may be difficult to reach.
- Poor Performance in Range-Bound Markets: In sideways consolidating markets, prices may frequently touch support/resistance levels without forming clear trends, leading to frequent trading and accumulation of small losses.
Solutions:
- Consider adding volume confirmation or other technical indicators (such as RSI, MACD) for multiple validations to reduce false signals
- Introduce dynamic support/resistance level calculation methods, such as using Fibonacci levels or dynamic pivot points
- Dynamically adjust profit targets and stop-loss levels based on market volatility
Strategy Optimization Directions
-
Dynamic Support/Resistance Levels: Change fixed support/resistance levels to automatically calculated dynamic levels, for example, using high/low points or pivot points from the past N trading days, allowing the strategy to self-adapt to changes in market structure.
-
Volatility Adjustment: Introduce the ATR (Average True Range) indicator to automatically adjust profit targets and stop-loss distances based on market volatility, maintaining optimal performance across different volatility environments.
-
Time Filtering: Add trading time window restrictions to avoid low liquidity periods or times of major economic data releases, reducing risks from abnormal fluctuations.
-
Position Management Optimization: Dynamically adjust position size based on signal strength or current account equity percentage, increasing positions in high-probability trades and decreasing in others.
-
Multi-timeframe Confirmation: Introduce multi-timeframe analysis, requiring that trends in higher timeframes align with the trading direction to improve signal quality.
-
Trailing Stop-Loss: Implement trailing stop-loss functionality, allowing adjustment of stop-loss levels as price moves favorably, locking in partial profits while giving price more room to breathe.
-
Backtesting Parameter Optimization: Systematically backtest optimize parameters such as EMA periods, support/resistance range percentages, and profit target ratios to find the parameter combination with the best historical performance.
These optimization directions will make the strategy more refined, improving its adaptability and profitability in various market environments while reducing risk.
Summary
The Multi-Level Take Profit Strategy with Support/Resistance and EMA Trend Filtering System is a quantitative trading strategy that combines fundamental principles of technical analysis. It identifies opportunities near key support and resistance levels while using EMA trend filters to ensure trades flow with the trend, thereby increasing trading success rates. The multi-level profit target design both maximizes profit potential and secures gains incrementally during price movements, while clear stop-loss levels effectively control risk.
The strategy's greatest advantage lies in integrating multiple mature technical analysis concepts into a systematic framework, reducing subjective judgment and improving trading discipline. However, the strategy also has issues such as false signal risks and parameter dependencies, which need to be optimized through additional confirmation mechanisms and dynamic parameter adjustments.
Overall, this is a well-founded strategy framework with clear logic, suitable for traders with a certain foundation in technical analysis, and can be further customized and optimized according to personal risk preferences and market environments. By implementing the suggested optimization directions, the strategy has the potential to become a more robust and adaptive trading system.
- 1