
Strategy Overview
The RSI Momentum Oscillator SwingRadar Trading Strategy is a long-only trading system that cleverly combines RSI/MA crossover signals with ATR-based risk management. This strategy is designed to capture clean entry points during potential market rebounds, particularly suitable for crypto assets like XMR/USDT. Its core logic consists of three key components: first, using the 14-period RSI crossing above its 14-period SMA as an entry signal, indicating a potential momentum shift; second, requiring the RSI on the previous candle to be below a user-defined oversold threshold (default: 35), focusing on capturing bounce opportunities after pullbacks; finally, utilizing the ATR indicator to dynamically set stop-loss and target levels, with the stop-loss placed below the current low by a certain ATR multiple (default 0.5×), and the profit target calculated using a risk-reward multiple (default 4×). These elements work together synergistically—RSI crossovers provide momentum confirmation, oversold filtering adds contextual information, and ATR-based exits adapt to market volatility, creating a compact yet responsive trading strategy.
Strategy Principles
Through deep code analysis, we can clearly understand how this strategy works:
-
Indicator Calculations:
- Uses the 14-period RSI indicator to capture price momentum
- Calculates a 14-period simple moving average (SMA) of the RSI as a momentum reference line
- Employs the 14-period ATR indicator to measure market volatility, providing the foundation for risk management
-
Entry Logic:
- The main entry condition combines two key elements:
- RSI crossing above its moving average, indicating positive momentum shift
- The previous period's RSI being in the oversold zone (default below 35), ensuring we look for bounce opportunities after price pullbacks
- This combination ensures the strategy only enters the market when there's sufficient momentum signal and the price has already experienced a certain degree of pullback
- The main entry condition combines two key elements:
-
Risk Management Mechanism:
- Stop-loss is set at 0.5× ATR distance below the current low
- Profit target is calculated based on the risk-reward ratio, defaulting to 4 times the stop-loss distance
- This mechanism allows the strategy to adapt to volatility conditions across different market environments
-
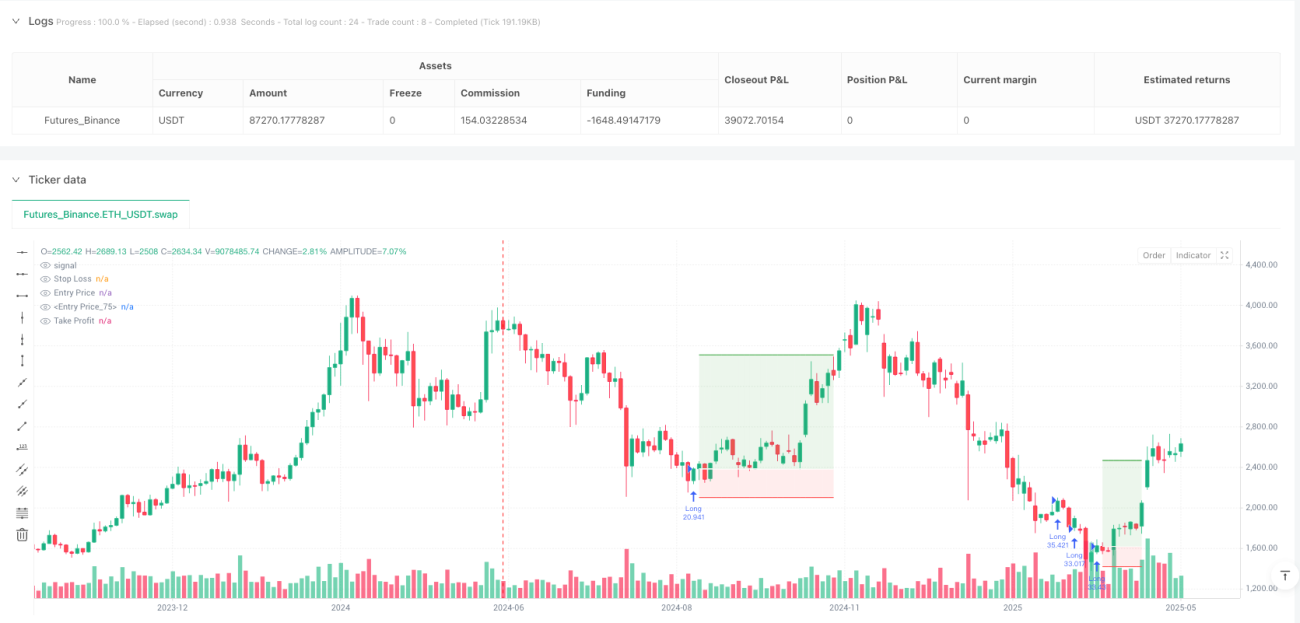
Chart Visualization:
- The strategy displays dynamic zones on the chart, including stop-loss level, entry price, and profit target
- These visual elements only appear when a trade is active, keeping the chart clean
This design makes the strategy both concise and efficient, tightly integrating technical analysis with risk management principles, particularly suitable for capturing pullback opportunities in uptrends.
Strategy Advantages
Through in-depth code analysis, several significant advantages of this strategy can be identified:
-
Momentum Confirmation Combined with Oversold Filter: The strategy not only requires the RSI to cross above its moving average (momentum confirmation) but also requires the previous RSI to be in the oversold zone. This dual confirmation mechanism effectively filters out weak signals, improving entry quality.
-
Volatility-Based Dynamic Risk Management: Using the ATR indicator to dynamically adjust stop-loss and profit targets, rather than fixed points, allows the strategy to adapt to different market environments and volatility conditions, which is particularly important in highly volatile markets like cryptocurrencies.
-
Fixed Risk-Reward Ratio Design: The default 4:1 risk-reward ratio design ensures that the potential return for each trade far exceeds the risk, which is conducive to capital growth in the long run, even with relatively lower win rates.
-
Visual Trade Management: The dynamic zones displayed on the chart allow traders to intuitively monitor trade status, stop-loss levels, and target levels, enhancing the convenience of trade management.
-
Adaptability and Flexibility: Strategy parameters such as RSI oversold threshold, risk-reward ratio, and ATR multiplier can all be adjusted according to different market conditions and personal risk preferences, enhancing the strategy's adaptability.
-
Focus on Pullbacks within Trends: The strategy focuses on capturing pullback rebound opportunities within uptrends, which typically offer higher probability of success and more clearly defined risk.
-
Clear Code Structure: The strategy code is well-organized with clear logic, making it easy to understand and modify, which is a significant advantage for traders looking to adjust the strategy to their specific needs.
Strategy Risks
Despite its rational design, there are several potential risks that traders should be aware of:
-
False Breakout Risk: RSI crossover signals may produce false breakouts, especially in range-bound markets. This can lead to frequent stop-loss exits, eroding account capital. Solution: Add additional confirmation indicators, such as volume confirmation or trend filters.
-
Gap Risk: Cryptocurrency markets may experience significant gaps, causing stop-losses to be jumped over, resulting in actual losses far greater than expected. Solution: Reasonably control risk exposure for each trade and avoid excessive leverage.
-
Parameter Sensitivity: Strategy performance is relatively sensitive to parameter settings (such as RSI oversold threshold, ATR multiplier), and different market environments may require different parameters. Solution: Conduct comprehensive backtesting and forward testing, preparing different parameter sets for various market conditions.
-
Limitations of Long-Only Strategy: The strategy is designed only for long positions, which may miss opportunities or suffer consecutive losses in bear markets or downtrends. Solution: Consider adding trend filters or developing complementary short strategies.
-
Fund Management Risk: The code is set to use 100% of funds for trading, which is too risky for actual trading. Solution: Adjust position size parameters and adopt more conservative fund management strategies, such as risking no more than 1-2% of total capital per trade.
-
Technical Dependency: The strategy relies entirely on technical indicators, ignoring fundamental factors and market structure. Solution: Use the strategy as an auxiliary tool for trading decisions, combined with broader market analysis.
-
Backtest Illusion: Strategy performance in backtesting may differ from actual trading, especially when considering slippage, liquidity, and abnormal market conditions. Solution: Conduct rigorous forward testing and small-scale live verification, gradually increasing trading size.
Strategy Optimization Directions
Based on in-depth code analysis, here are possible optimization directions for this strategy:
-
Add Trend Filters: Introduce long-term moving averages or other trend indicators to ensure trades are only taken in the direction of the primary trend. This can significantly improve the strategy's adaptability across different market environments and reduce the risk of counter-trend trading.
-
Optimize Fund Management: Modify the default 100% fund usage ratio to implement more scientific risk management, such as dynamic position adjustment based on account volatility or fixed risk proportion management. This is crucial for long-term survival and capital growth.
-
Add Volume Confirmation: Integrate volume analysis into entry conditions, executing trades only when supported by volume. Volume is an important confirmation factor for price movements and can reduce losses from false breakouts.
-
Develop Short Logic: Extend the strategy to include short logic, using RSI crossing below overbought zones as potential short signals. This would allow the strategy to remain active in various market environments, not just uptrends.
-
Add Time Filters: Implement trading time window filters to avoid periods with abnormal volatility or to fully utilize trading opportunities during specific periods. This is particularly useful for 24/7 markets like cryptocurrencies.
-
Introduce Machine Learning Optimization: Use machine learning techniques to optimize parameter selection, dynamically adjusting strategy parameters based on different market conditions. This can improve the strategy's adaptability and long-term stability.
-
Add Partial Profit-Taking Mechanism: Implement a staged profit-taking mechanism, securing partial profits when reaching certain levels, while leaving the remainder to track the trend. This approach balances short-term gains with long-term potential.
-
Integrate Market Sentiment Indicators: Consider integrating broader market sentiment indicators, such as volatility indices or fund flow indicators, to provide additional market context. These indicators can help assess market environment and improve entry decision quality.
Summary
The RSI Momentum Oscillator SwingRadar Trading Strategy is an ingeniously designed trading system that, by combining RSI/MA crossover signals with ATR-based risk management, provides traders with an effective tool for capturing market pullback rebound opportunities. This strategy is particularly suitable for finding high-quality entry points in uptrends, pursuing reasonable returns while controlling risk through dynamic stop-losses and fixed risk-reward ratio design.
The core advantage of the strategy lies in its concise yet effective design approach, combining momentum confirmation with oversold condition filtering, and adapting to market volatility through the ATR indicator. However, users should be aware of the strategy's limitations, including false breakout risks, parameter sensitivity, and long-only restrictions, addressing these challenges through reasonable risk management and strategy optimization.
For the future development of the strategy, directions such as adding trend filters, optimizing fund management, introducing volume confirmation, and developing complementary short strategies all have the potential to further enhance the system's robustness and adaptability. Most importantly, traders should view this strategy as one component in an overall trading system, combining it with personal market analysis and risk management principles to fully realize its potential.
Through deep understanding and rational application of this strategy, traders can build a trading system that is both responsive and risk-controlled in highly volatile markets, laying the foundation for long-term trading success.
- 1