RSI Divergence Trap Sniper Strategy

Overview
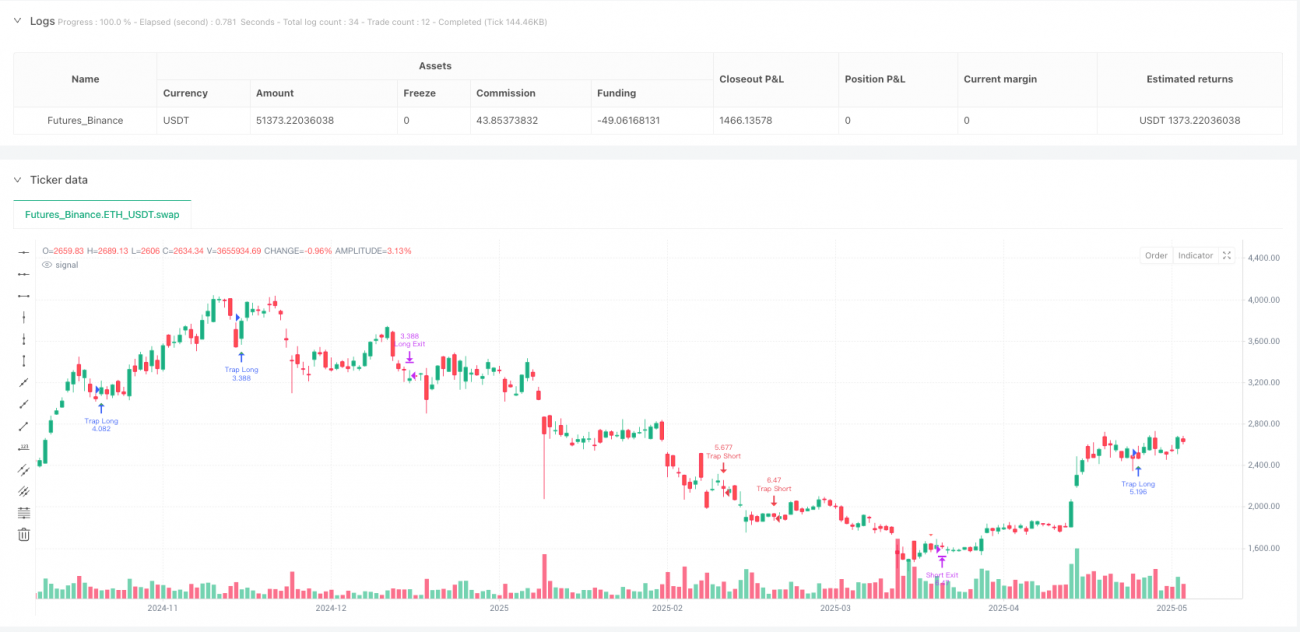
The RSI Divergence Trap Sniper Strategy is a counterintuitive momentum-following trading system that identifies "reversal traps"—situations where market participants expect a market reversal based on RSI indicators, but the price continues in its original trend. Unlike traditional RSI applications, this strategy doesn't trade against the trend when RSI shows overbought or oversold signals; instead, it waits for these signals to fail and then trades with the trend, capturing strong trend continuation movements. When RSI drops from the overbought zone but prices continue to rise, the strategy opens long positions; when RSI rises from the oversold zone but prices continue to fall, the strategy opens short positions. This unique approach leverages the additional momentum provided by traders who misinterpret RSI signals.
Strategy Principles
The core of this strategy is monitoring the relationship between the Relative Strength Index (RSI) and price action, looking for "trap" formations:
-
Long Trap Identification: When RSI falls from above the overbought level (default 70) to below it, while the price continues to rise (current closing price higher than the previous closing price), the system recognizes this as a bullish trap and opens a long position.
-
Short Trap Identification: When RSI rises from below the oversold level (default 30) to above it, while the price continues to fall (current closing price lower than the previous closing price), the system recognizes this as a bearish trap and opens a short position.
-
Risk Management Mechanism: After entry, the strategy uses dynamic stop-loss and take-profit points based on Average True Range (ATR). The stop-loss is set at one ATR distance from the entry price, and the take-profit is set at two ATR distances (default risk-reward ratio of 2.0).
-
Time-Based Exit Mechanism: To prevent long-term positions, the strategy sets a maximum holding period (default 30 candles), automatically closing positions after this time limit.
The trap detection logic in the code is as follows:
rsiTrapLong = rsi[3] > rsiOverbought and rsi < rsiOverbought and close > close[1]
rsiTrapShort = rsi[3] < rsiOversold and rsi > rsiOversold and close < close[1]
This indicates that the system checks whether the RSI indicator was in the overbought/oversold zone 3 periods ago, whether it has now fallen/risen below/above the threshold, and whether the price continues to move in its original direction.
Strategy Advantages
-
Psychological Edge: This strategy gains an advantage by exploiting common misunderstandings of RSI signals in the market. When most traders prepare to go short after RSI falls from overbought levels, yet find prices continuing to rise, they are often forced to close positions, further pushing prices up.
-
Trend Following: Although entry points are based on RSI reversal signals, this is essentially a trend-following system, consistent with the trading wisdom that "the trend is your friend."
-
Clear Risk Management: Using ATR to set stop-loss and take-profit levels allows risk management to adapt to changes in market volatility, which is more scientific than fixed-point stops.
-
Automatic Time-Based Exit: By setting a maximum holding period (30 candles), the risk of long-term trapped positions is avoided, ensuring capital liquidity.
-
Visual Feedback: The strategy provides clear entry markers on the chart, allowing traders to intuitively understand the trading logic, facilitating backtest analysis and strategy optimization.
-
Realistic Trading Assumptions: The strategy considers a 0.05% commission and slippage, more closely approximating real trading environments and improving backtest credibility.
Strategy Risks
-
Sudden Trend Reversal Risk: Although the strategy is designed to capture trend continuations, markets may suddenly reverse direction after entry, especially during major news or black swan events.
-
Parameter Sensitivity: RSI length and overbought/oversold threshold settings significantly impact strategy performance. Different markets and time periods may require different parameter settings, and incorrect parameters may lead to excessive false signals.
-
Poor Performance in Low-Volatility Markets: In sideways or low-volatility markets, RSI may frequently cross overbought/oversold thresholds with limited price movement, potentially resulting in multiple small losses.
-
Liquidity Risk: In less liquid markets, ATR may be underestimated, causing stop-losses to be set too tight and triggered by market noise.
-
Drawdown Risk: When markets experience strong trend reversals, consecutive losses may occur, producing significant drawdowns.
Solutions:
- Pause trading before major economic data releases
- Optimize RSI parameters for different markets and time periods
- Add additional filtering conditions in low-volatility environments
- Consider adding trend confirmation indicators (such as moving averages)
- Implement money management rules to limit single-trade risk
Strategy Optimization Directions
- Add Trend Filters: The current strategy relies solely on RSI and price dynamics. Consider adding trend filtering conditions, such as only entering when the moving average direction aligns with the trade direction:
            ema200 = ta.ema(close, 200)
trend_up = close > ema200
trend_down = close < ema200
rsiTrapLong = rsi[3] > rsiOverbought and rsi < rsiOverbought and close > close[1] and trend_up
rsiTrapShort = rsi[3] < rsiOversold and rsi > rsiOversold and close < close[1] and trend_down
- Optimize RSI Lookback Period: The current code uses a fixed 3-period lookback to detect if RSI has exceeded thresholds. Consider making this parameter adjustable or implementing a dynamic lookback window:
            lookback = input.int(3, title="RSI Pattern Lookback")
rsiTrapLong = rsi[lookback] > rsiOverbought and rsi < rsiOverbought and close > close[1]
- Dynamic Risk-Reward Ratio: Currently using a fixed risk-reward ratio (2.0), consider dynamically adjusting based on market volatility or trend strength:
            volatility_factor = math.max(1.5, math.min(3.0, ta.atr(5) / ta.atr(20) * 2))
longTP = strategy.position_avg_price + atr * volatility_factor
- Add Volume Confirmation: Add volume analysis to ensure sufficient trading volume supports trend continuation when traps form:
            volume_increase = volume > ta.sma(volume, 20)
rsiTrapLong = rsi[3] > rsiOverbought and rsi < rsiOverbought and close > close[1] and volume_increase
- Optimize Time-Based Exit Mechanism: The current fixed 30-candle exit might miss major trends. Implement a price-based trailing stop:
            trail_percent = input.float(1.0, "Trailing Stop %") / 100
strategy.exit("Long Trail", from_entry="Trap Long", trail_points=strategy.position_avg_price * trail_percent)
These optimization directions aim to improve the strategy's robustness and adaptability, reduce false signals, and enhance risk management capabilities while maintaining the original logic.
Summary
The RSI Divergence Trap Sniper Strategy is a unique reverse-thinking trading system that doesn't simply use RSI's overbought/oversold signals but looks for moments when these signals fail, capturing trend continuation opportunities. By identifying "trap" formations where RSI falls/rises but prices continue moving in their original direction, the strategy can effectively discover signals that are misinterpreted in the market and profit from them.
This strategy combines ATR dynamic risk management to ensure stop-loss and take-profit settings adapt to market volatility, while setting a maximum holding period to prevent long-term trapped positions. The main advantage of the strategy lies on the psychological level—creating entry opportunities by leveraging the incorrect expectations of traditional technical analysis traders, essentially being a trend-following method.
Despite risks such as parameter sensitivity and market environment adaptability, the strategy can be further enhanced by adding trend filters, optimizing RSI parameters, dynamically adjusting risk-reward ratios, and more. In particular, combining additional market structure analysis and volume confirmation can significantly improve signal quality.
For quantitative traders, the RSI Divergence Trap Sniper Strategy provides an innovative framework, demonstrating how to combine traditional indicators with reverse thinking, challenge conventional trading logic, and develop trading systems with unique advantages.
/*backtest
start: 2024-05-30 00:00:00
end: 2025-05-29 00:00:00
period: 1d
basePeriod: 1d
exchanges: [{"eid":"Futures_Binance","currency":"ETH_USDT"}]
*/

//@version=5
strategy("Reversal Trap Sniper – Verified Version", overlay=true, default_qty_type=strategy.percent_of_equity, default_qty_value=25, commission_type=strategy.commission.percent, commission_value=0.05, slippage=1)

// === INPUTS ===- 1