Momentum-Filtered Smoothed Z-Score Crossover Price Statistical Trading Strategy

Overview
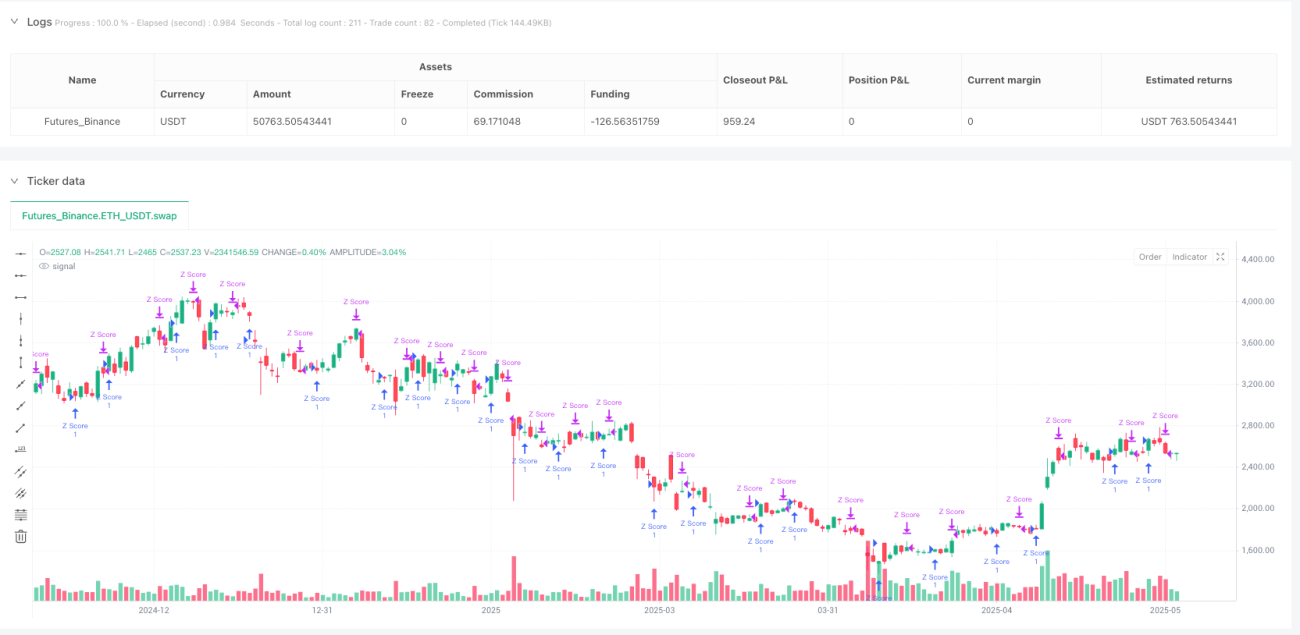
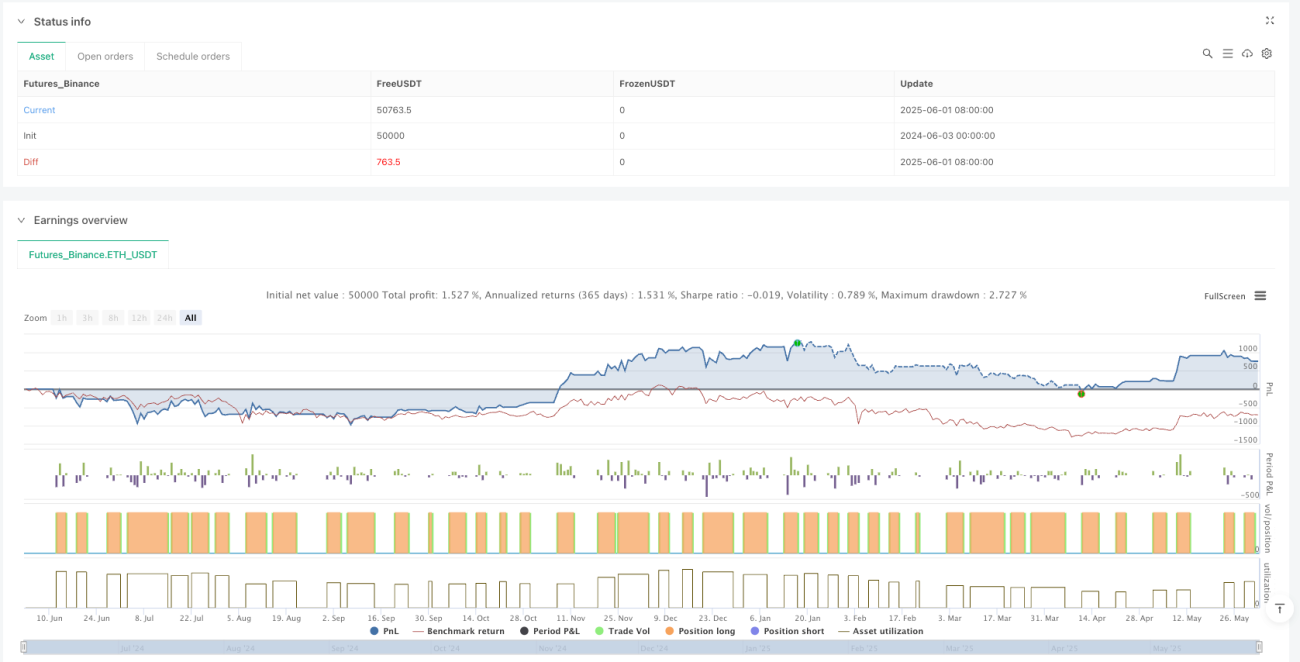
This strategy is based on the Z-Score statistical concept, used to identify statistical deviations of price relative to its local mean. The strategy calculates the Z-Score of closing prices and applies short-term and long-term moving averages to smooth the Z-Score values. Long entry signals are generated when the short-term smoothed Z-Score crosses above the long-term smoothed Z-Score, and exit signals are generated when the short-term smoothed Z-Score crosses below the long-term smoothed Z-Score. The strategy also includes signal spacing control and momentum-based candle filters to reduce noise trading.
Strategy Principles
The core of this strategy is the calculation and application of Z-Score. Z-Score is a statistical measure that quantifies how far a data point is from the sample mean, measured in standard deviations. In this strategy, the Z-Score calculation formula is:
Z = (Close - SMA(Close, N)) / STDEV(Close, N)
where N is the user-defined base period.
The strategy execution process is as follows:
- Calculate the raw Z-Score of the closing price
- Apply short-term smoothing (SMA) to the raw Z-Score
- Apply long-term smoothing (SMA) to the raw Z-Score
- When the short-term smoothed Z-Score crosses above the long-term smoothed Z-Score, if additional conditions are met, open a long position
- When the short-term smoothed Z-Score crosses below the long-term smoothed Z-Score, if additional conditions are met, close the position
Additional conditions include:
- Signal gap: A minimum number of candles must pass between two signals of the same type (entry or exit)
- Momentum filter: Entry is prohibited when three or more consecutive bullish candles occur; exit is prohibited when three or more consecutive bearish candles occur
Strategy Advantages
- Statistical Foundation: Z-Score is a mature statistical tool that effectively identifies the degree to which prices deviate from their mean, suitable for capturing mean reversion opportunities.
- Smoothing Processing: By applying short-term and long-term smoothing to the raw Z-Score, noise is reduced and signal quality is improved.
- Signal Spacing Control: By setting a minimum signal gap, excessive trading and redundant signals are effectively reduced.
- Momentum Filter: By prohibiting counter-trend trading in strong trends, unnecessary losses in strong market conditions are avoided.
- Simplicity: The strategy only uses closing price data, does not rely on complex indicator combinations, and is easy to understand and implement.
- Real-time P&L Monitoring: Includes a table displaying unrealized profit and loss in real-time, facilitating position status monitoring for traders.
- Parameter Flexibility: Users can adjust the Z-Score base period and smoothing parameters according to different markets and timeframes, improving adaptability.
Strategy Risks
- Statistical Assumption Risk: Z-Score assumes that price distribution approximates a normal distribution and may perform poorly in markets with non-normal distributions.
- Parameter Sensitivity: The choice of Z-Score base period and smoothing parameters has a significant impact on strategy performance. Improper parameter selection may lead to overfitting or signal lag.
- Single-Factor Limitation: The strategy generates signals based solely on Z-Score crossovers, lacking other confirmation indicators, which may lead to false signals.
- Market Environment Dependency: In strong trending markets, mean-reversion based strategies may continuously produce erroneous signals.
- Signal Lag: Due to the use of moving average smoothing, signals may exhibit lag, missing optimal entry or exit points.
Solutions:
- Backtest different market environments to find optimal parameter combinations
- Integrate trend filters to reduce or disable trading in strong trending markets
- Add additional confirmation indicators such as volume analysis or other technical indicators
- Consider using adaptive parameters that automatically adjust based on market volatility
Optimization Directions
- Trend Recognition Integration: Add trend recognition components to adjust strategy behavior in markets with clear trend directions. This can be implemented through long-term moving averages or ADX indicators, avoiding incorrect mean reversion signals in strong trends.
- Volatility Adjustment: Implement adaptive adjustment of Z-Score parameters based on market volatility to automatically optimize the base period and smoothing parameters. This will improve strategy robustness across different market environments.
- Multiple Timeframe Analysis: Integrate Z-Score signals from higher timeframes as confirmation, only trading when signals across multiple timeframes align, reducing false signals.
- Stop Loss Mechanism: Implement dynamic stop losses based on Z-Score fluctuation ranges to enhance risk management capabilities. For example, stops could be set at specific deviation multiples from the entry Z-Score.
- Partial Profit Taking: Implement a staged profit-taking strategy, partially closing positions when Z-Scores reach specific thresholds to optimize capital management.
- Volume Confirmation: Add volume analysis as trade confirmation, executing trades only when Z-Score signals are supported by volume, improving signal quality.
- Indicator Combination: Combine Z-Score with other statistical or technical indicators, such as RSI or Bollinger Bands, to create a multi-factor decision model, enhancing strategy reliability.
Summary
The Momentum-Filtered Smoothed Z-Score Crossover Price Statistical Trading Strategy is a concise trading system based on statistical principles, focused on capturing price deviations and reversions relative to local means. Through smoothing processing, signal spacing control, and momentum filtering, the strategy effectively reduces noise trading and improves signal quality. The strategy is particularly suitable for oscillating markets and financial products with obvious mean-reversion behavior.
However, the strategy also has some limitations, such as dependence on statistical assumptions, parameter sensitivity, and single-factor decision-making. By adding trend recognition, volatility adjustment, multi-timeframe analysis, stop-loss mechanisms, volume confirmation, and multi-factor combinations, the robustness and performance of the strategy can be significantly enhanced.
Overall, this is a strategy framework with solid theoretical foundations, simple implementation, and ease of understanding and extension. It is suitable as a basic component of trading systems or as an educational tool to help traders understand the application of statistics in trading.
- 1