
Overview
The Dual-Indicator Trend-Momentum Crossover System is a quantitative trading strategy that combines long-term Exponential Moving Average (EMA) with the Percentage Price Oscillator (PPO). This strategy primarily identifies entry points by monitoring the crossover relationship between price and EMA400, as well as the intersection of the PPO line with its signal line. The core concept is to capture turning points in long-term trends while using momentum indicators for confirmation, thereby increasing the success rate of trades. The system designs four trading signals: basic buy, basic sell, strategic buy, and strategic sell, achieving comprehensive market trend capture through the synergistic effect of these four signals.
Strategy Principles
The trading logic of this strategy is based on the following core components:
-
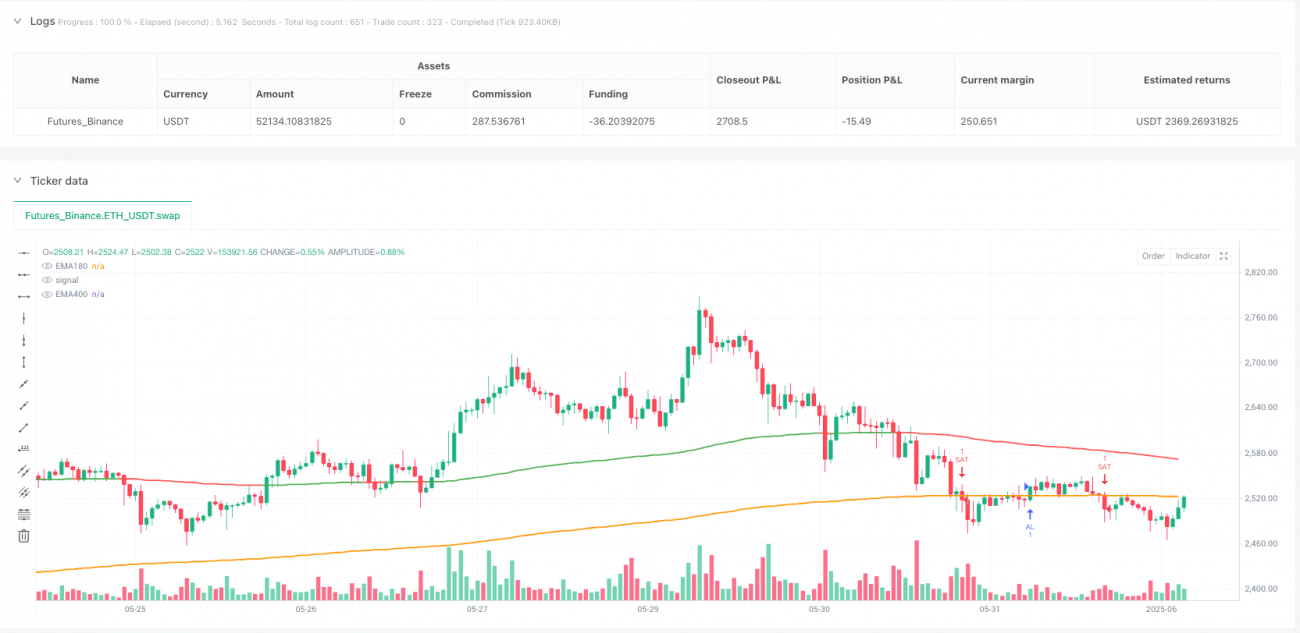
Long-term Trend Identification: Using the 400-period Exponential Moving Average (EMA400) as the criterion for long-term trend judgment, generating buy signals when price crosses above EMA400 and sell signals when it crosses below.
-
Medium-term Trend Confirmation: Using the 180-period Exponential Moving Average (EMA180) as an auxiliary reference, visually displaying the medium-term trend direction through color changes (green when price is above EMA180, red when below).
-
Momentum Indicator Verification: Using PPO (Percentage Price Oscillator) for momentum analysis, which consists of:
- Fast EMA (12 periods)
- Slow EMA (26 periods)
- Signal line (9-period EMA of PPO)
- PPO line calculation formula: ((Fast EMA - Slow EMA) / Slow EMA) * 100
-
Composite Signal System:
- Basic Buy: Price crosses above EMA400
- Basic Sell: Price crosses below EMA400
- Strategic Buy: Price is above EMA400 and PPO line crosses above signal line
- Strategic Sell: Price is below EMA400 and PPO line crosses below signal line
The uniqueness of this strategy lies in combining long-term trend analysis with momentum confirmation, capable of capturing major trend turning points while finding high-probability entry points within trends, forming a complete trading decision system.
Strategy Advantages
Through in-depth analysis of this trading system, the following significant advantages can be summarized:
-
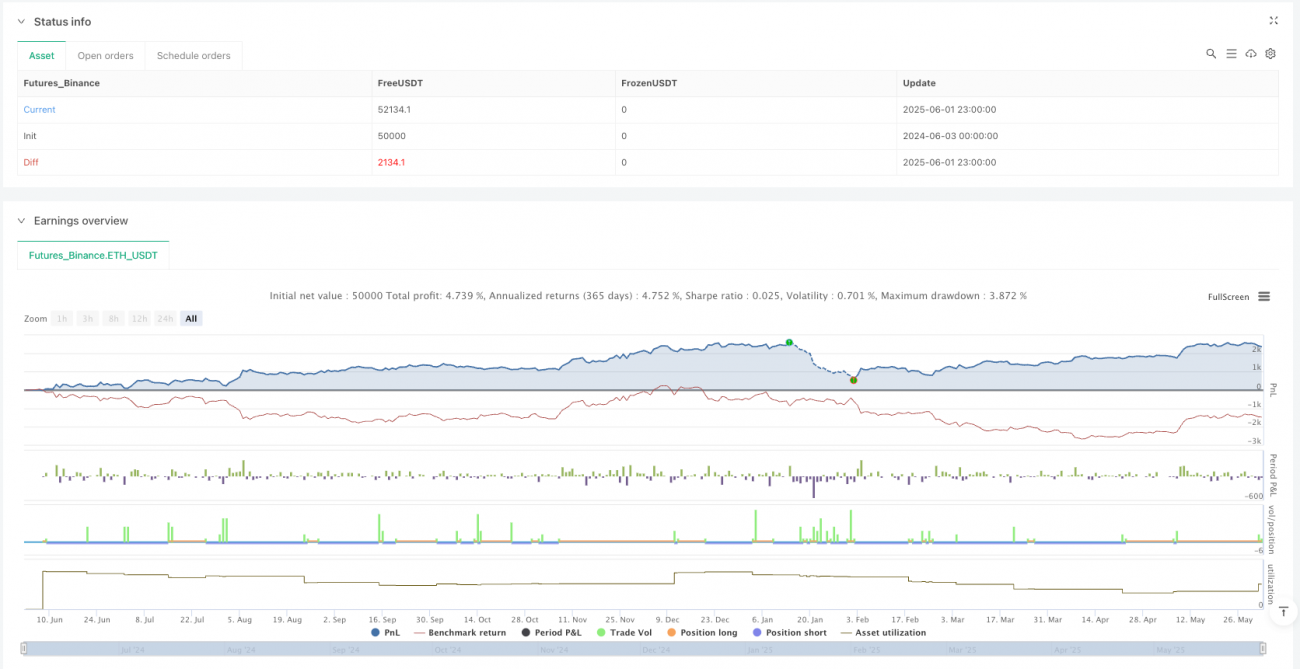
Multi-level Trend Confirmation Mechanism: By simultaneously using EMA400 and EMA180, the strategy can identify market trends across different time periods, reducing risks from false breakouts. The long-period EMA (400) provides the main trend direction, while the medium-period EMA (180) provides trend confirmation and visual assistance.
-
Synergistic Effect of Momentum and Trend: Combining the PPO momentum indicator with the EMA trend indicator forms a complementary relationship. When a trend is established (price above or below EMA) and the momentum indicator confirms (PPO crossover), the reliability of trading signals significantly increases.
-
Signal Classification System: Distinguishing between basic signals and strategic signals allows traders to choose entry points of different strengths according to risk preference and market environment. Strategic signals require more stringent conditions (trend direction + momentum confirmation), thus typically having a higher success rate.
-
Visual Intuitiveness: The strategy clearly marks trading signals on the chart and visually displays trend status through EMA180 color changes, facilitating rapid market environment assessment by traders.
-
Flexible Alert Mechanism: Built-in alert settings for four different conditions allow traders to configure alerts according to their needs, avoiding missing important trading opportunities.
-
Suitable for Long-term Investment: Using long-period (400) EMA as the main reference makes this strategy particularly suitable for medium to long-term investors, reducing short-term noise interference and focusing on capturing major trend changes.
Strategy Risks
Despite its reasonable design, this strategy still has the following potential risks:
-
Lag Risk: EMAs are inherently lagging indicators, especially the 400-period EMA which has more significant lag. This may cause entry points to be delayed from actual trend turning points, missing some profits or generating larger drawdowns in volatile markets.
-
Poor Performance in Ranging Markets: In long-term consolidation or narrow-range oscillating market environments, the strategy may produce frequent false crossover signals, leading to overtrading and consecutive losses.
-
Fixed Parameters Lack Adaptability: The strategy uses fixed EMA periods (400 and 180) and PPO parameters, lacking adaptive capability for different market conditions and instrument characteristics.
-
Dependence on Single Technical Indicators: Relying solely on EMA and PPO technical indicators without incorporating fundamental analysis or other types of technical indicators (such as volatility, volume), may lead to misjudgments in certain specific market environments.
-
Absence of Money Management: The code does not include stop-loss, take-profit, position management, or other risk control mechanisms, potentially facing the risk of excessive single-trade losses in actual trading.
Solutions:
- Introduce adaptive period parameters that dynamically adjust EMA length based on market volatility
- Add market environment filters to pause trading in ranging markets
- Integrate other types of indicators (such as RSI, ATR) for signal confirmation
- Add stop-loss, take-profit, and position management rules
- Implement time filtering to avoid high-volatility periods
Strategy Optimization Directions
Based on in-depth analysis of the code, this strategy can be optimized in the following directions:
-
Parameter Optimization and Adaptive Mechanisms:
- Introduce adaptive EMA periods that dynamically adjust according to market volatility (such as the ATR indicator)
- Set different parameter sets for different market environments (trending markets, oscillating markets)
- Reason: Fixed parameters struggle to adapt to all market conditions; adaptive parameters can improve the strategy's universality
-
Signal Filtering Enhancement:
- Add volume confirmation mechanisms, requiring significant volume expansion when signals appear
- Incorporate trend strength filters (such as the ADX indicator), executing trades only when trends are clear
- Reason: Reduce false signals and improve the success rate of each trade
-
Risk Management Improvement:
- Add dynamic stop-loss mechanisms based on ATR
- Implement profit-tracking take-profit functionality
- Design volatility-based position management systems
- Reason: Comprehensive risk management is key to long-term stable profitability
-
Multi-timeframe Analysis Integration:
- Add higher timeframe trend judgment, trading only when higher timeframe trend direction is consistent
- Implement multi-timeframe PPO signal confirmation
- Reason: Multi-timeframe synergy can significantly improve signal quality
-
Market Adaptability Expansion:
- Set differentiated parameters for different trading instrument categories (such as stocks, forex, commodities)
- Add filters for overnight trading and high-volatility periods
- Reason: Different markets have different characteristics requiring targeted optimization
-
Machine Learning Enhancement:
- Use machine learning algorithms to dynamically optimize EMA and PPO parameters
- Introduce pattern recognition functionality to identify historically high-success-rate price patterns
- Reason: Machine learning can capture market patterns difficult to quantify with traditional technical analysis
Summary
The Dual-Indicator Trend-Momentum Crossover System constructs a trading system that can both capture long-term trend reversals and confirm short-term momentum changes by combining long-period EMA and PPO indicators. The core advantages of this strategy lie in its multi-level signal confirmation mechanism and clear trading rules, particularly suitable for investors pursuing medium to long-term trend trading.
However, the strategy also has issues such as lag risk, fixed parameters, and lack of risk management. Through the introduction of adaptive parameter mechanisms, multi-timeframe analysis, comprehensive risk control systems, and machine learning enhancement, this strategy has the potential to further improve its adaptability and profitability in different market environments.
Overall, this is a reasonably designed, logically clear trading system that combines traditional trend-following ideas with modern quantitative trading techniques, providing traders with a reliable decision-making framework. Through continuous optimization and improvement, this strategy has the potential to become a robust long-term trading system.
- 1