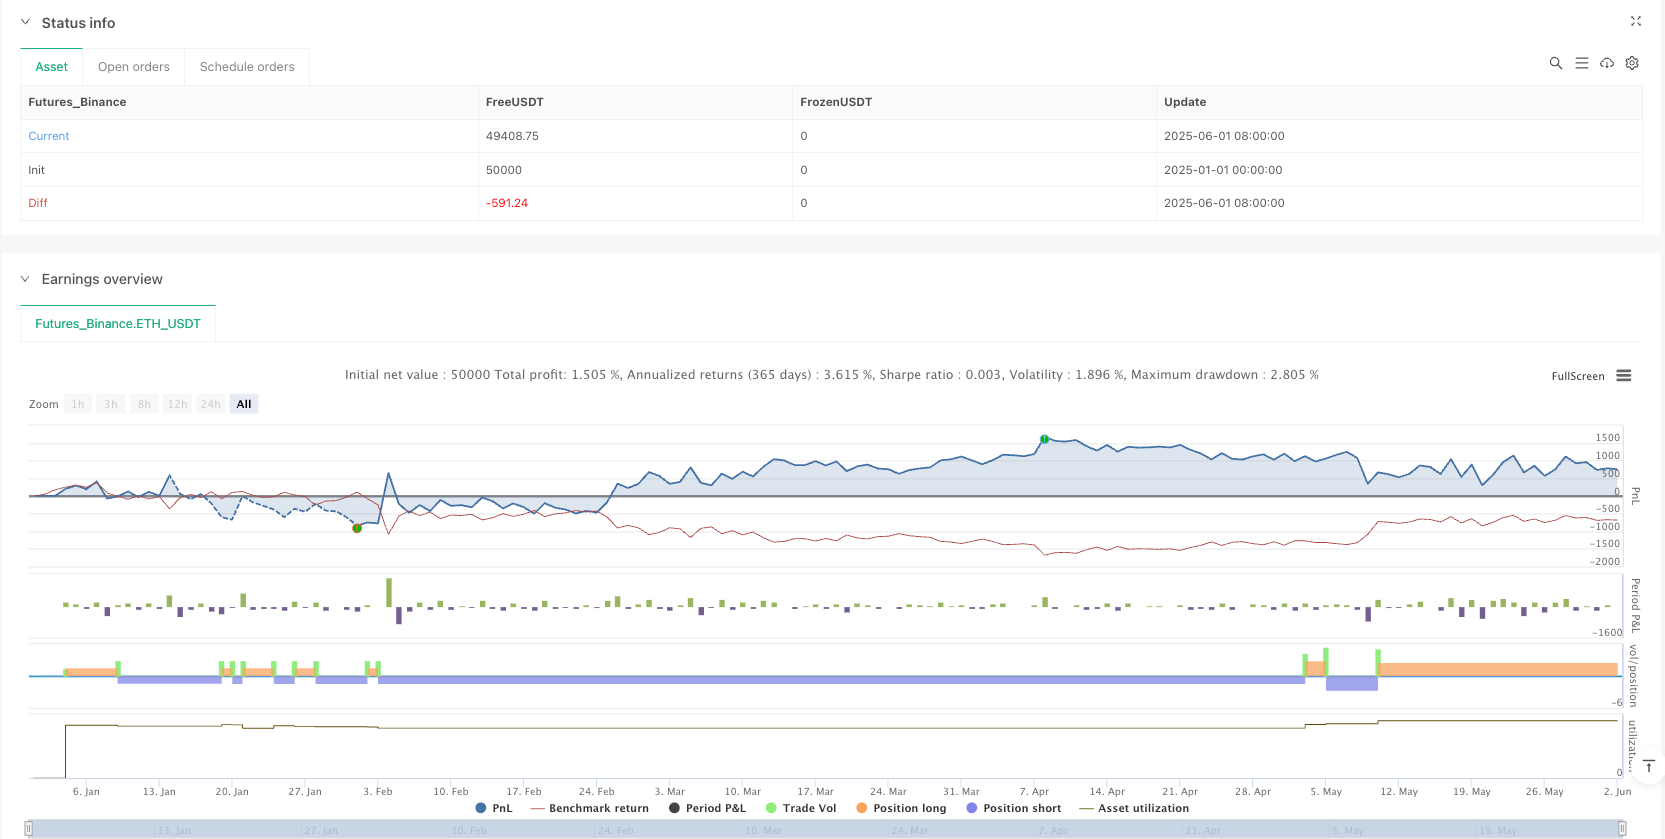
Multi-Indicator Momentum Oscillation Strategy: Big Candle+RSI+EMA+Fibonacci Retracement Trading System
RSI EMA FIBONACCI Price Action Candlestick Patterns momentum Oscillators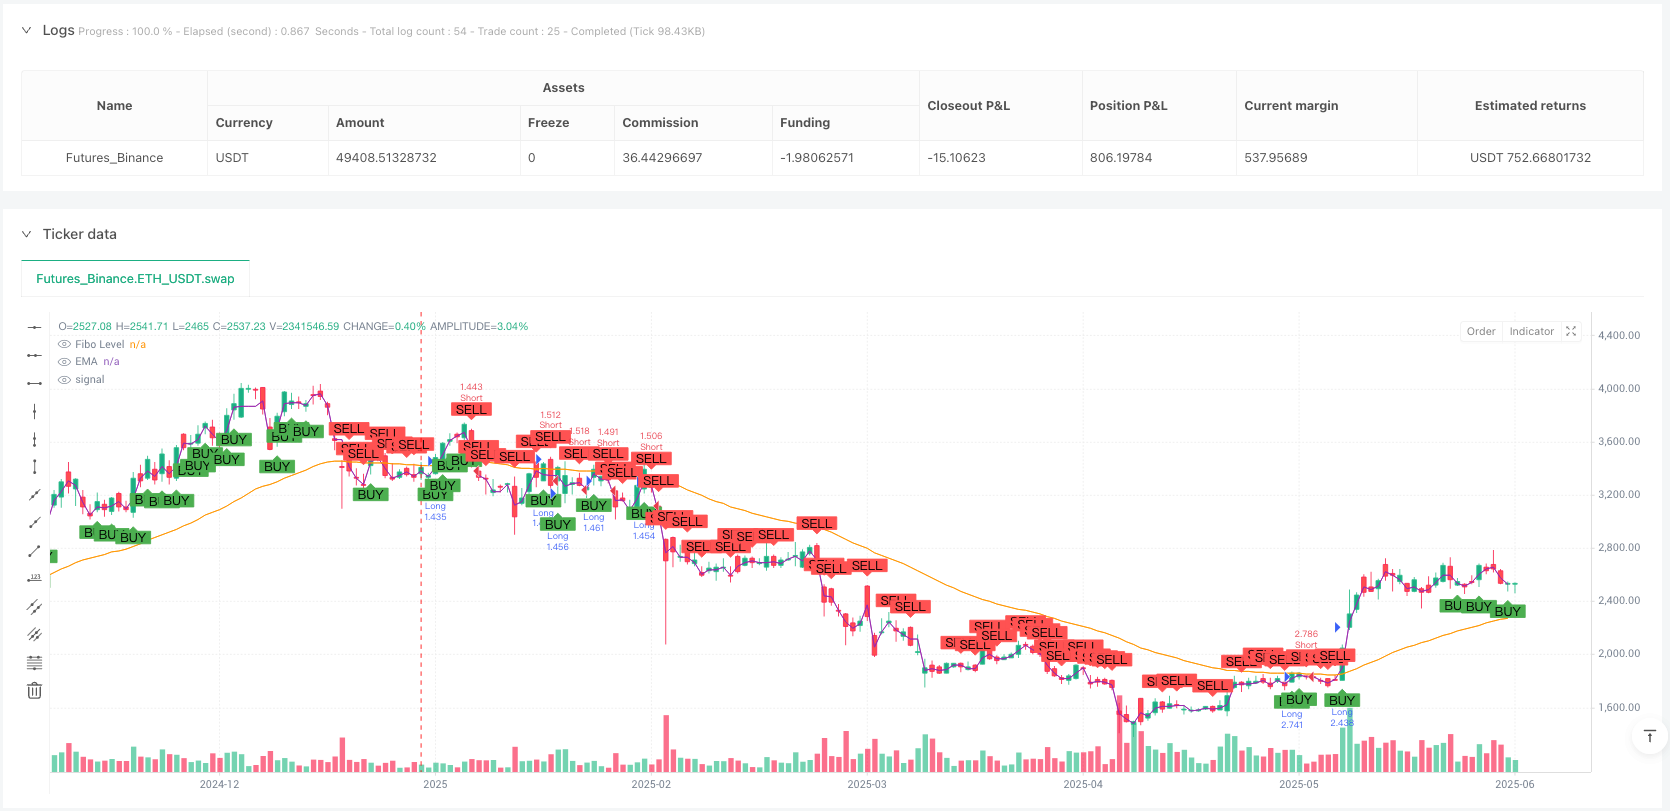
Overview
The Multi-Indicator Momentum Oscillation Strategy is a quantitative trading system that combines price action analysis, technical indicators, and Fibonacci retracement levels. This strategy primarily identifies large bullish or bearish candles with significant body size (relative to their overall range), then filters them through RSI to avoid overbought/oversold conditions, confirms trend direction using EMA, and leverages Fibonacci retracement levels to identify potential entry points. This multi-layered filtering mechanism aims to capture high-probability trading opportunities following price breakouts while reducing the risks associated with false breakouts.
Strategy Principles
The core principles of this strategy are based on the synergistic interaction of four key components:
Big Candle Detection: The strategy first calculates the percentage of the candle’s body (absolute difference between open and close) relative to its full range (high minus low). When this percentage exceeds a preset threshold (default 1.5%), it’s considered a valid big candle, indicating strong directional momentum in the market.
Trend Confirmation: A 50-period Exponential Moving Average (EMA) confirms the current market trend. Long entries require price to be above the EMA, while short entries require price to be below the EMA, helping to trade with the trend and avoid counter-trend trading.
RSI Filtering: The Relative Strength Index (RSI) is used to filter extreme market conditions. Long signals require RSI below 70 (avoiding overbought territory), while short signals require RSI above 30 (avoiding oversold territory), effectively reducing the risk of entering during unfavorable market conditions.
Fibonacci Retracement Levels: The strategy calculates a Fibonacci retracement level (default 0.618) based on the body of the big candle. This level is considered a potential support or resistance area, providing reference for subsequent price action.
Entry conditions are clearly defined: - Long Entry: Big bullish candle (close > open), body ratio exceeding threshold, RSI < 70, price > EMA(50) - Short Entry: Big bearish candle (close < open), body ratio exceeding threshold, RSI > 30, price < EMA(50)
Additionally, the strategy incorporates elements of multi-timeframe analysis, retrieving high and low data from 5-minute and 1-hour charts to provide additional context for trading decisions.
Strategy Advantages
Through in-depth code analysis, this strategy demonstrates the following significant advantages:
Multiple Confirmation Mechanism: Combines price action (big candles), momentum indicator (RSI), trend indicator (EMA), and price levels (Fibonacci), forming a powerful multi-layered filtering system that effectively reduces false signals.
Trend-Following Approach: The strategy emphasizes alignment with the main trend, validating entry direction through EMA, avoiding the high risk associated with counter-trend trading.
Volatility Adaptability: By defining big candles as a percentage relative to their range rather than absolute price movements, the strategy can adapt to different volatility environments and various trading instruments.
Visual Feedback System: The strategy marks entry points and draws horizontal lines on the chart, providing traders with clear visual feedback for backtest analysis and real-time trade monitoring.
Flexible Parameter Settings: All key parameters (RSI period, EMA period, Fibonacci retracement level, minimum body size) are adjustable, allowing traders to optimize the strategy according to different market conditions and personal risk preferences.
Multi-Timeframe Analysis: Incorporates data from higher and lower timeframes, providing more comprehensive market context for entry decisions, helping to identify higher quality trading opportunities.
Strategy Risks
Despite its multiple advantages, the strategy still presents the following potential risks:
False Breakout Risk: While big candles indicate strong directionality, they may form false breakouts in volatile markets. The solution is to add confirmation signals, such as waiting for additional confirmation candles or incorporating volume indicators.
Parameter Sensitivity: Strategy performance is sensitive to parameter selection, especially the EMA period and minimum body percentage. Incorrect parameter settings may lead to overtrading or missing important opportunities. Historical backtesting is recommended to determine optimal parameter combinations.
Lack of Clear Exit Mechanism: The current code doesn’t define explicit take-profit/stop-loss strategies, which may lead to profit giveback or expanded losses. Clear exit rules should be added, such as using Fibonacci extension levels to set profit targets.
Trend Reversal Risk: In strong trending markets, RSI may remain in overbought or oversold territories for extended periods, causing missed trading opportunities. Consider adjusting RSI thresholds or adding trend strength indicators in strong trend environments.
Timeframe Conflict: Although the code introduces multi-timeframe data, it isn’t fully integrated into the trading logic, potentially leading to conflicting signals across different timeframes. Clear definitions should be established for handling cross-timeframe signal conflicts.
Strategy Optimization Directions
Based on code analysis, here are potential optimization directions for the strategy:
Refine Exit Mechanism: Introduce take-profit and stop-loss rules based on Fibonacci extensions, technical indicators, or fixed risk-reward ratios. This is crucial for protecting profits and controlling risk, and can significantly improve the overall stability of the strategy.
Strengthen Multi-Timeframe Logic: Fully utilize the already acquired 5-minute and 1-hour data to develop filtering rules based on multi-timeframe confirmation. For example, only confirm long signals when the current price breaks above the higher timeframe high, helping to reduce noisy trades.
Integrate Volume Analysis: Big candles accompanied by high volume typically indicate stronger momentum. Adding volume confirmation conditions can improve signal quality and filter out low-volume false breakouts.
Dynamic Parameter Optimization: Implement dynamic parameter adjustments based on market volatility, such as increasing the minimum body percentage threshold in high-volatility environments and decreasing it in low-volatility environments, allowing the strategy to better adapt to changing market conditions.
Add Market Environment Filtering: Introduce market environment classification (such as trending, ranging, or high-volatility) and customize trading rules for different environments. For instance, stricter entry conditions might be needed in ranging markets.
Add Trading Time Filters: Consider the impact of market sessions on strategy performance, avoiding periods of low liquidity or abnormal volatility, such as by restricting trading to major trading sessions to improve signal quality.
Incorporate Machine Learning Models: Use historical data to train machine learning models that predict the probability of price movement directions after big candle formation, providing additional statistical support for entry decisions.
Summary
The Multi-Indicator Momentum Oscillation Strategy is a thoughtfully designed trading system that establishes a comprehensive trading decision framework by combining big candle identification, RSI filtering, EMA trend confirmation, and Fibonacci retracement levels. Its greatest strength lies in its multi-layered signal confirmation mechanism, which effectively improves trading signal quality, while the strategy’s adjustable parameters enable it to adapt to different market environments.
However, there is still room for improvement, particularly in exit mechanisms, multi-timeframe integration, and market environment adaptability. By implementing the suggested optimization measures, especially perfecting take-profit/stop-loss mechanisms and strengthening multi-timeframe analysis, the strategy’s robustness and profitability can be significantly enhanced.
For quantitative traders, this strategy provides a solid foundation framework that can be further customized and optimized according to individual trading styles and target market characteristics. Ultimately, the success of the strategy depends not only on its technical design but also on the trader’s understanding of the market and execution discipline.
/*backtest
start: 2025-01-01 00:00:00
end: 2025-06-02 00:00:00
period: 1d
basePeriod: 1d
exchanges: [{"eid":"Futures_Binance","currency":"ETH_USDT"}]
*/

// This Pine Script® code is subject to the terms of the Mozilla Public License 2.0 at https://mozilla.org/MPL/2.0/
// © InvesT_Go2P

//@version=5
strategy("Big_RSI_EMA_Fib", overlay=true, default_qty_type=strategy.percent_of_equity, default_qty_value=10)

// === INPUTS ===
rsiPeriod   = input.int(14, "RSI Period")
emaPeriod   = input.int(50, "EMA Period")
fibRetrace  = input.float(0.618, "Fibonacci Retracement", minval=0.1, maxval=0.9)
bodySizePct = input.float(1.5, "Minimum Body Size (%)", step=0.1)

// === INDICATORS ===
rsi = ta.rsi(close, rsiPeriod)
ema = ta.ema(close, emaPeriod)

// === BIG CANDLE LOGIC ===
body = math.abs(close - open)
full = high - low
bodyPct = (body / full) * 100
isBigCandle = bodyPct > bodySizePct

isBullishBig = isBigCandle and close > open
isBearishBig = isBigCandle and close < open

// === FIBONACCI LEVELS ===
var float fib0 = na
var float fib1 = na
var float fibRetraceLevel = na

if isBullishBig
    fib0 := open
    fib1 := close
    fibRetraceLevel := fib1 - (fib1 - fib0) * fibRetrace

if isBearishBig
    fib0 := close
    fib1 := open
    fibRetraceLevel := fib1 + (fib0 - fib1) * fibRetrace

// === ENTRY CONDITIONS ===
longCond = isBullishBig and close > ema and rsi < 70
shortCond = isBearishBig and close < ema and rsi > 30

// === STRATEGY ENTRIES ===
if longCond
    strategy.entry("Long", strategy.long)

if shortCond
    strategy.entry("Short", strategy.short)

// === EXITS (Add TP/SL logic here if needed) ===

// === PLOTS ===
plot(ema, title="EMA", color=color.orange)
plotshape(longCond, location=location.belowbar, color=color.green, style=shape.labelup, text="BUY")
plotshape(shortCond, location=location.abovebar, color=color.red, style=shape.labeldown, text="SELL")

// === FIBONACCI LEVEL VISUALIZATION ===
plot(fibRetraceLevel, title="Fibonacci Level", color=color.purple, linewidth=1)

// === Example Logic: Check if current price is above the high of 5m and 1h timeframes ===
high_5m = request.security(syminfo.tickerid, "5", high)
low_5m  = request.security(syminfo.tickerid, "5", low)

high_1h = request.security(syminfo.tickerid, "60", high)
low_1h  = request.security(syminfo.tickerid, "60", low)