Overview
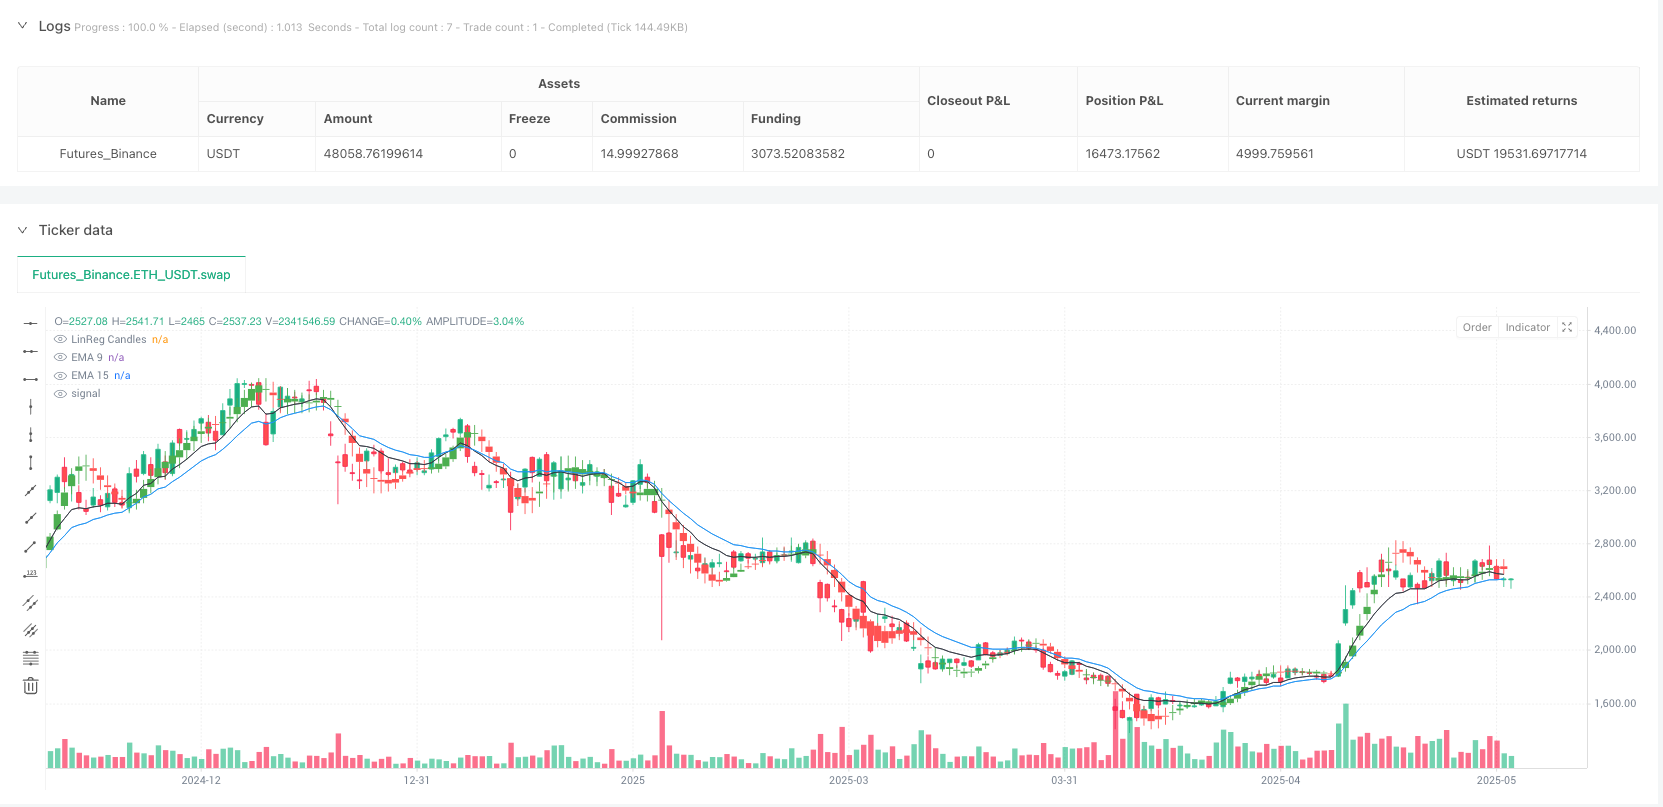
The Multi-Timeframe Linear Regression Candle Trend Optimization Trading System is a quantitative strategy that makes trading decisions based on price data smoothed by linear regression processing. This strategy combines linear regression techniques, moving average smoothing, and multi-timeframe analysis methods to determine trading signals based on candle color consistency across the current timeframe and the 15-minute timeframe. The core of the strategy lies in using linear regression algorithms to process price data, eliminate market noise, while utilizing moving average indicators to assist in judging market trends, ultimately providing precise buy and sell signals at key price positions (highs and lows after linear regression processing).
Strategy Principles
The core principles of this strategy are based on the following key technical components:
Linear Regression Candle Processing: The strategy first applies a linear regression algorithm (ta.linreg) to the original open, high, low, and close prices, with a period length defined by a user-customizable parameter (default is 11). Linear regression can effectively reduce random fluctuations in price data, presenting a smoother price trend.
Signal Smoothing: To further eliminate noise, the strategy applies a Simple Moving Average (SMA) to the linear regression processed price data for additional smoothing, with a smoothing period defined by a user-customizable parameter (default is 3). This step ensures the stability of trading signals and reduces the generation of false signals.
Trend Confirmation Indicators: The strategy uses two Exponential Moving Averages (EMA 9 and EMA 15) as trend confirmation tools to help traders determine the overall direction of the current market.
Multi-Timeframe Analysis: The strategy innovatively combines data analysis from the current timeframe and the 15-minute timeframe. Trading signals are triggered only when the candle colors in both timeframes are consistent (both bullish or both bearish), improving trading accuracy.
Signal Generation Logic:
- Buy condition: Current candle is green (closing price higher than opening price) and the linear regression candle in the 15-minute timeframe is also green
- Sell condition: Current candle is red (closing price lower than opening price) and the linear regression candle in the 15-minute timeframe is also red
Visualization of Trading Signals: The strategy displays green triangles (buy signals) at the lows of the linear regression processed candles and red triangles (sell signals) at the highs, intuitively showing trading opportunities.
Strategy Advantages
Reduction of Market Noise Impact: Through the dual smoothing processing of linear regression and moving averages, the strategy effectively reduces the interference of random market fluctuations, making trading decisions more objective and reliable.
Precise Entry Points: The strategy provides signals at the highs and lows of linear regression processed candles, which typically represent short-term support and resistance, offering better risk-reward ratios for trades.
Multi-Timeframe Confirmation Mechanism: By combining analyses from current and higher timeframes, the reliability of trading signals is significantly improved, avoiding misjudgments that might occur with single timeframe analysis.
Visual Intuitiveness: Through colored candles and clear triangular markers, the strategy allows traders to intuitively identify trading signals, facilitating quick decision-making.
Parameter Adjustability: The strategy provides multiple customizable parameters, including linear regression length, signal smoothing period, and moving average periods, allowing traders to optimize adjustments based on different market environments and personal risk preferences.
Systematic Trading Logic: The strategy adopts clear trading rules, eliminating the influence of emotional factors on trading decisions, helping traders maintain discipline.
Strategy Risks
Lag Risk: Both linear regression and moving average processing introduce a certain amount of lag, which may cause signal delays in rapidly changing markets, missing optimal entry points or delaying stop-losses. The solution is to adjust parameter lengths according to different market volatility - shorter linear regression and smoothing periods for fast markets.
Poor Performance in Ranging Markets: In ranging markets without clear trends, the strategy may produce frequent false signals, leading to frequent trading and losses. It is recommended to add filtering conditions or pause trading in such market environments.
Lack of Stop-Loss Mechanism: There is no explicit stop-loss strategy in the code, which may lead to larger losses when incorrect signals occur. It is recommended to set fixed stop-losses or dynamic stop-losses based on technical indicators in practical applications.
Parameter Sensitivity: Strategy performance is relatively sensitive to parameter selection, and different parameter settings may perform significantly differently in various market environments. It is recommended to find the most suitable parameter combinations for specific markets through historical data backtesting and periodically re-optimize.
Potential Conflicts in Multi-Timeframe Analysis: At market turning points, signals from different timeframes may become inconsistent, delaying trading opportunities. Consider introducing additional confirmation indicators or dynamically adjusting multi-timeframe weights.
Strategy Optimization Directions
Introduce Adaptive Parameter Mechanisms: Dynamic adjustment of linear regression and moving average period lengths based on market volatility (such as the ATR indicator) can help the strategy better adapt to different market environments. This optimization can improve the strategy’s adaptability in changing markets and reduce the frequency of parameter optimization.
Incorporate Profit-Taking and Stop-Loss Mechanisms: Add a comprehensive risk management system to the strategy, including fixed stop-losses, trailing stops, and target profits, to protect capital safety and lock in profits. Good risk management is a key element for long-term profitability.
Enhance Signal Filtering Conditions: Additional technical indicators (such as RSI, MACD, or volume indicators) can be introduced as confirmation tools to filter out potential false signals. For example, only accept signals when RSI indicates overbought/oversold areas, or require volume confirmation.
Add Time Filters: Some markets may have excessive volatility or insufficient liquidity during specific time periods. Adding time filtering functionality can avoid trading during these unfavorable periods.
Optimize Multi-Timeframe Analysis Methods: Consider introducing data from more timeframes (such as hourly or daily) and using weighted algorithms to synthesize signal strengths from multiple timeframes, rather than simple binary judgments, to improve signal quality.
Capital Management Optimization: The current strategy uses a fixed percentage of capital for trading. This can be improved to dynamic position management based on volatility or signal strength, increasing positions on high-confidence signals and reducing positions on low-confidence signals.
Add Market Environment Filters: Develop algorithms to identify whether the market is in a trending or ranging state, reduce trading or adjust strategy parameters in ranging markets to adapt to different market environments.
Summary
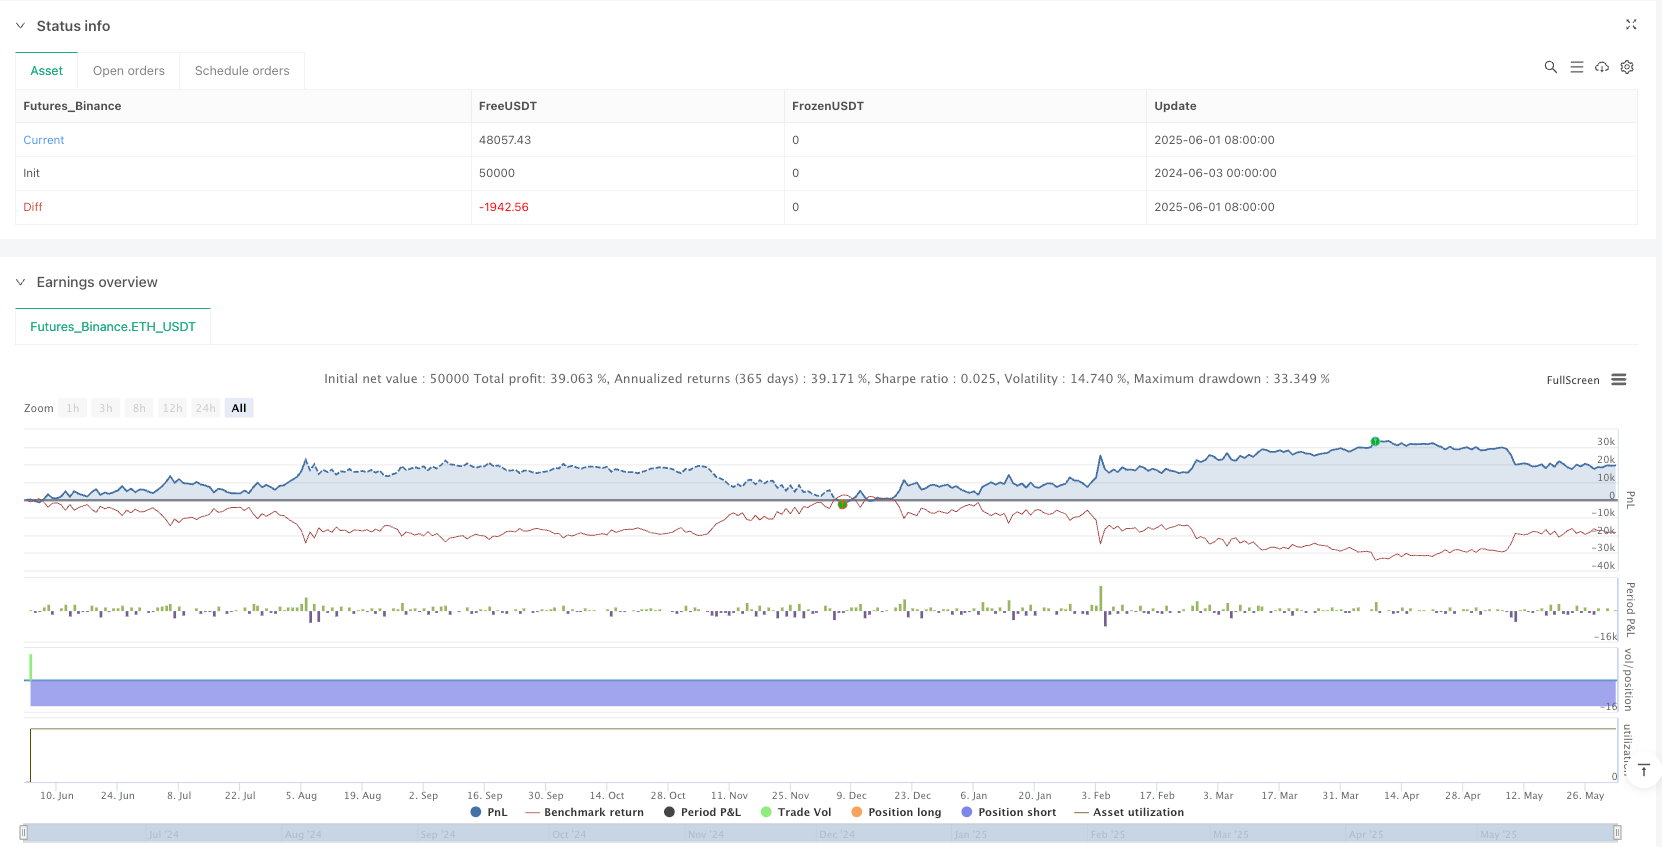
The Multi-Timeframe Linear Regression Candle Trend Optimization Trading System is a quantitative trading strategy that combines linear regression techniques, moving averages, and multi-timeframe analysis. Through dual smoothing processing of price data and multi-timeframe confirmation mechanisms, this strategy can effectively filter market noise and provide clear trading signals at key price levels.
The main advantages of the strategy lie in its ability to reduce noise, precise entry points, and multi-timeframe confirmation mechanisms, but it also faces risks such as signal lag and parameter sensitivity. By introducing adaptive parameter mechanisms, comprehensive risk management systems, enhanced signal filtering conditions, and optimized multi-timeframe analysis methods, this strategy has the potential to further improve its stability and profitability.
Overall, this is a technical analysis trading system with clear logic and a well-structured framework, particularly suitable for medium to long-term trend traders. With reasonable parameter optimization and risk management, this strategy can achieve stable trading performance in various market environments. For traders who value systematic trading and technical analysis, this is a strategy framework worth studying and implementing.
/*backtest
start: 2024-06-03 00:00:00
end: 2025-06-02 00:00:00
period: 1d
basePeriod: 1d
exchanges: [{"eid":"Futures_Binance","currency":"ETH_USDT"}]
*/

//@version=5
strategy("LinReg Candle Strategy - Arrows at LinReg High/Low", overlay=true, default_qty_type=strategy.percent_of_equity, default_qty_value=100)

// === INPUTS === //
lrLen = input.int(11, "Linear Regression Length")
maLen = input.int(3, "Signal Smoothing MA")
ema1Len = input.int(9, "EMA 9")
ema2Len = input.int(15, "EMA 15")

// === LINREG CANDLES (Smoothed) === //
lrOpen = ta.linreg(open, lrLen, 0)
lrHigh = ta.linreg(high, lrLen, 0)
lrLow = ta.linreg(low, lrLen, 0)
lrClose = ta.linreg(close, lrLen, 0)

smOpen = ta.sma(lrOpen, maLen)
smHigh = ta.sma(lrHigh, maLen)
smLow = ta.sma(lrLow, maLen)
smClose = ta.sma(lrClose, maLen)

candleColor = smClose > smOpen ? color.green : smClose < smOpen ? color.red : color.gray
plotcandle(smOpen, smHigh, smLow, smClose, color=candleColor, wickcolor=candleColor, title="LinReg Candles")

// === EMAs === //
ema9 = ta.ema(close, ema1Len)
ema15 = ta.ema(close, ema2Len)
plot(ema9, "EMA 9", color=color.black)
plot(ema15, "EMA 15", color=color.blue)

// === 15-MIN LINREG CANDLE COLOR === //
fifOpen = request.security(syminfo.tickerid, "15", ta.linreg(open, lrLen, 0))
fifClose = request.security(syminfo.tickerid, "15", ta.linreg(close, lrLen, 0))
fifColor = fifClose > fifOpen ? 1 : -1

// === CURRENT CANDLE COLOR === //
currColor = close > open ? 1 : close < open ? -1 : 0

// === SIGNAL CONDITIONS === //
buyCond = currColor == 1 and fifColor == 1
sellCond = currColor == -1 and fifColor == -1

// === STRATEGY ENTRIES === //
if buyCond
    strategy.entry("BUY", strategy.long)
if sellCond
    strategy.entry("SELL", strategy.short)

// === PLOT ARROWS AT LINREG CANDLE LOW/HIGH === //
if buyCond
    label.new(bar_index, smLow, style=label.style_triangleup, color=color.green, size=size.small, text="")

if sellCond
    label.new(bar_index, smHigh, style=label.style_triangledown, color=color.red, size=size.small, text="")