
Overview
The Multi-Indicator Confluence Momentum Trading Strategy is a quantitative trading system that combines multiple technical indicators designed to capture market trend reversal points and confirm trading signals. This strategy integrates Exponential Moving Averages (EMA), Moving Average Convergence Divergence (MACD), Relative Strength Index (RSI), and Fibonacci automatic retracement levels, while using Average True Range (ATR) to dynamically adjust stop-loss and take-profit targets. This multi-layered signal confirmation mechanism aims to reduce false signals, improve trading accuracy, and control risk exposure for each trade using precise risk management parameters.
Strategy Principles
The core principle of this strategy is to confirm trading signals through multi-indicator confluence, executing trades only when all conditions are simultaneously met. Specifically:
-
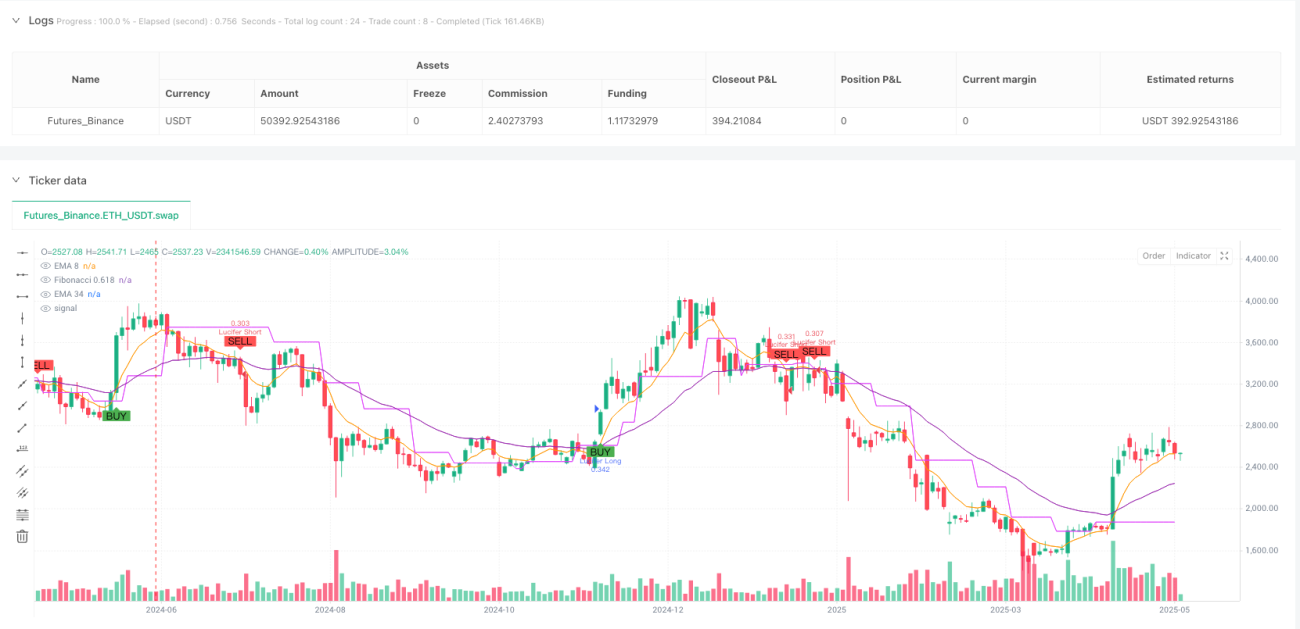
EMA Crossover Signals: Uses 8-period and 34-period exponential moving averages. A buy signal is generated when the short-term EMA(8) crosses above the long-term EMA(34); a sell signal is generated when the short-term EMA crosses below the long-term EMA.
-
MACD Trend Confirmation: Uses the MACD indicator with standard parameters (12,26,9). MACD line above the signal line confirms bullish momentum; MACD line below the signal line confirms bearish momentum.
-
RSI Momentum Filter: Uses 14-period RSI for filtering. Buy conditions require RSI between 45-70, indicating upward momentum without being excessively overbought; sell conditions require RSI between 30-55, indicating downward momentum without being excessively oversold.
-
Fibonacci Position Confirmation: The system automatically identifies recent swing highs and lows, calculating the 0.618 Fibonacci retracement level. Long trades require price to be above the 0.618 retracement line, while short trades require price to be below this line.
-
Risk Management: Uses 14-period ATR to dynamically set stop-loss and take-profit levels. Stop-loss is set at 1.5 times ATR distance from the entry price, while take-profit is set at 2.0 times ATR distance, creating a 1:1.33 risk-reward ratio.
Long Entry Conditions: EMA8 crosses above EMA34 + MACD line above signal line + RSI between 45-70 + price above 0.618 Fibonacci level
Short Entry Conditions: EMA8 crosses below EMA34 + MACD line below signal line + RSI between 30-55 + price below 0.618 Fibonacci level
Strategy Advantages
-
Multiple Confirmation Mechanism: By combining multiple different types of indicators (trend, momentum, volatility, price structure), the strategy significantly reduces false signals and improves trade success rate.
-
Strong Adaptability: Fibonacci levels automatically adjust based on recent market structure, allowing the strategy to adapt to different market environments and price volatility patterns.
-
Precise Risk Management: Uses ATR to dynamically adjust stop-loss and take-profit levels, ensuring risk management matches current market volatility and avoiding fixed levels triggering too early in highly volatile markets.
-
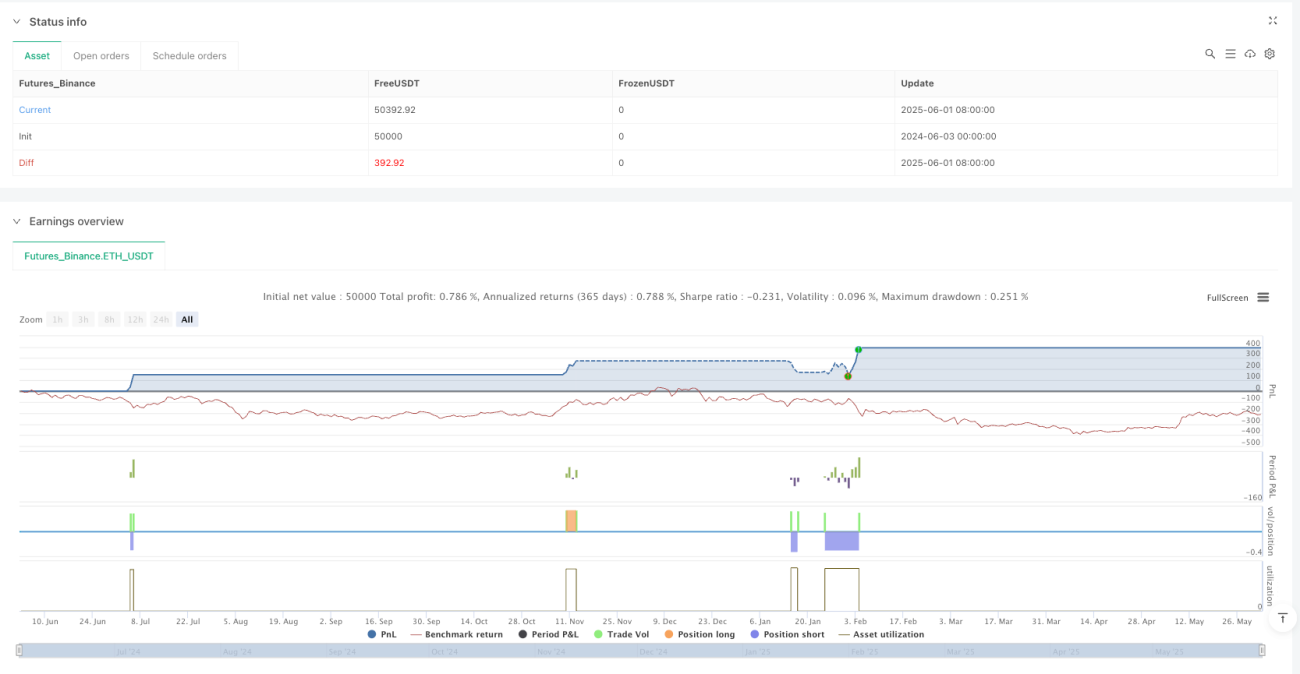
Clear Risk-Reward Ratio: Preset 1:1.33 risk-reward ratio can maintain profitability in the long run even with a win rate of only 50%.
-
Complementary Technical Indicators: The selected indicators each focus on different aspects of the market, working together to form a more comprehensive market perspective. EMA focuses on trends, MACD captures momentum, RSI measures overbought/oversold conditions, and Fibonacci identifies key support/resistance levels.
-
Flexible Application Range: The code shows the strategy can be applied to different timeframes (15 minutes and 1 hour), suitable for traders with different trading styles.
Strategy Risks
-
Scarce Signals: Multiple confirmation requirements may lead to relatively few trading signals, potentially missing profitable opportunities under certain market conditions.
-
Poor Performance in Ranging Markets: The strategy is primarily designed for trending markets and may perform poorly in sideways, ranging markets, generating more losing trades.
-
Parameter Sensitivity: Multiple parameters including EMA, RSI, and ATR multipliers need to be optimized for different markets; inappropriate parameter selection may affect strategy performance.
-
Over-reliance on Historical Pivots: Fibonacci levels depend on accurate identification of historical pivot highs and lows, which may lead to inaccurate level setting in rapidly changing markets.
-
Fixed Risk Multiplier Limitations: Although ATR can adapt to volatility, the fixed multipliers (1.5 and 2.0) may not be suitable for all market environments.
Mitigation Measures:
- Combine market volatility indicators or volume filters to avoid trading during low volatility or low volume periods
- Adjust EMA and RSI parameters for different markets
- Consider adding trend filters to trade only when trend direction is clear
- Regularly backtest and optimize parameters to ensure strategy matches current market environment
Strategy Optimization Directions
-
Dynamic Parameter Adjustment: Currently the strategy uses fixed parameters; implementing parameters that dynamically adjust with market volatility could be beneficial. For example, extending EMA periods in high-volatility environments and shortening them in low-volatility environments would make the strategy more adaptive.
-
Add Volume Filters: The code comments mention potentially pairing with volume filters, which is a worthwhile optimization direction. Rules could be added to execute trades only when volume is above n-day average levels, avoiding trading in low-liquidity environments.
-
Trend Strength Assessment: Adding ADX (Average Directional Index) to assess trend strength and executing trades only when the trend is strong enough would further reduce losing trades in ranging markets.
-
Entry Timing Optimization: The current strategy enters immediately upon indicator confluence; adding pullback confirmation, such as waiting for a minor retracement before entering, typically provides better entry prices.
-
Dynamic Risk-Reward Ratio: Adjusting the risk-reward ratio dynamically based on market volatility conditions and trend strength, rather than fixed 1.5 and 2.0 times ATR. For example, setting more relaxed take-profit levels in strong trends to capture larger moves.
-
Time Filters: Adding time filters to avoid specific inefficient trading sessions, such as transition periods between Asian, European, and American trading sessions, which typically have lower volatility or unclear direction.
-
Multi-Timeframe Analysis: Integrating the trend direction from higher timeframes as a trading filter to ensure trade direction aligns with the larger trend, improving win rate.
Summary
The Multi-Indicator Confluence Momentum Trading Strategy is a comprehensive and rigorous quantitative trading system that builds a multi-layered signal confirmation mechanism by integrating EMA crossovers, MACD trend confirmation, RSI momentum filtering, and Fibonacci position confirmation. The strategy uses ATR to dynamically adjust stop-loss and take-profit levels, ensuring risk management matches market volatility and creates a favorable risk-reward ratio.
The main advantages of the strategy lie in its multiple confirmation mechanism and precise risk management, effectively reducing false signals and controlling risk exposure. However, the strategy also faces risks such as scarce signals and poor performance in ranging markets. Through optimization directions like dynamic parameter adjustment, adding volume filters, and multi-timeframe analysis, the strategy's robustness and profitability can be further enhanced.
Overall, this is a well-designed trend-following strategy suitable for medium to long-term traders. With reasonable parameter adjustments and risk management, the strategy can maintain stable performance across different market environments. For traders looking to use technical analysis for systematic trading, this is a worthwhile basic framework that can be further customized according to personal trading style and market characteristics.
/*backtest
start: 2024-06-03 00:00:00
end: 2025-06-02 00:00:00
period: 2d
basePeriod: 2d
exchanges: [{"eid":"Futures_Binance","currency":"ETH_USDT"}]
*/

//@version=5
strategy("Lucifer Strategy – BTC & Gold (15min/1hr)", overlay=true, default_qty_type=strategy.percent_of_equity, default_qty_value=2)

// === EMAs ===- 1