
Overview
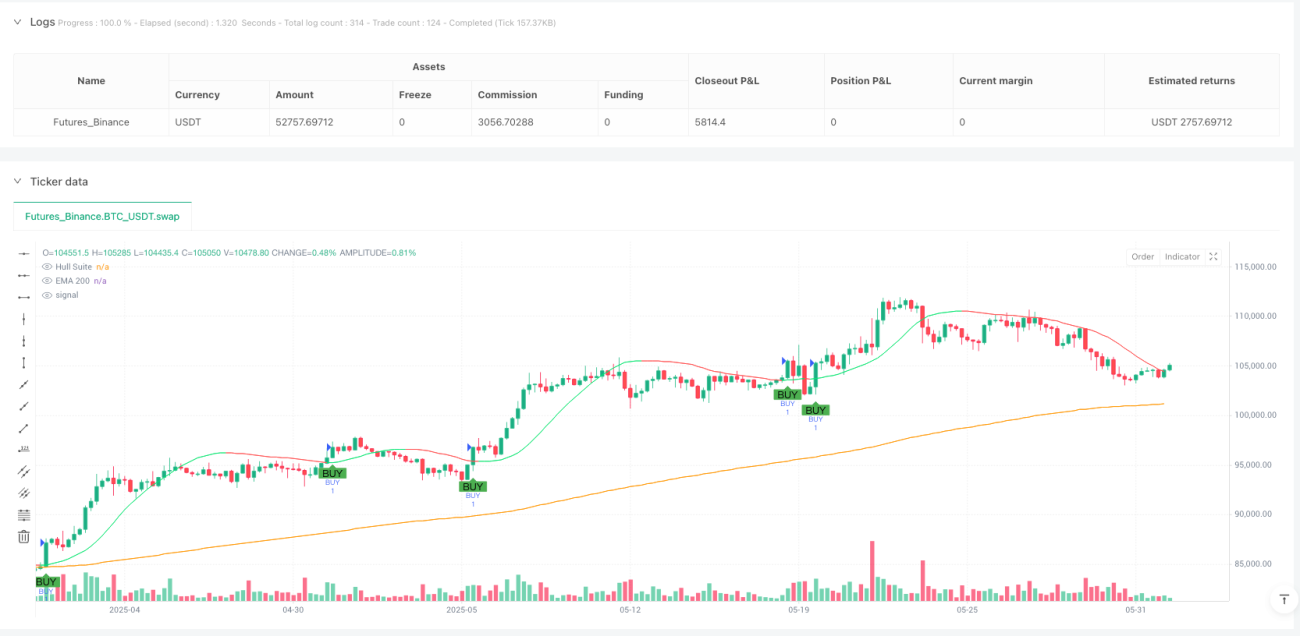
This Multi-Timeframe Momentum Confluence Trend Following Strategy is a quantitative trading system that integrates multiple layers of technical indicators to capture sustained trend opportunities in the market by combining long-term trend assessment with short-term momentum confirmation. The strategy cleverly integrates three powerful technical analysis tools: EMA 200 as a long-term trend filter, Hull Moving Average (HMA) providing medium-term momentum guidance, and MACD crossovers as precise entry signal triggers. This multi-layer confirmation mechanism design ensures that trading signals have higher reliability, effectively filtering out market noise and allowing traders to focus on high-probability trend following opportunities.
Strategy Principles
The core logic of this strategy is based on multi-timeframe trend confirmation principles, forming trading decisions through a three-layer indicator screening process:
-
Long-term Trend Direction Assessment: EMA 200 serves as the primary trend filter, dividing bullish and bearish market environments. Price above EMA 200 is considered an uptrend environment, suitable for long positions; price below EMA 200 is considered a downtrend environment, suitable for short positions.
-
Medium-term Momentum Identification: The Hull Moving Average (HMA) uses a 55-period parameter and provides faster trend response and directional guidance than traditional moving averages through its unique calculation method:
ta.wma(2 * ta.wma(close, hullPeriod / 2) - ta.wma(close, hullPeriod), math.round(math.sqrt(hullPeriod))). -
Short-term Signal Triggering: MACD indicator (parameters 12,26,9) golden crosses and death crosses serve as the final trading trigger conditions, ensuring entry when momentum changes.
Buy conditions are clearly defined as:
- Price above EMA 200 (priceAboveEMA = close > ema200)
- Hull condition satisfied (price above Hull or Hull line moving up) (hullConditionBuy = close > hull or hull > hullPrev)
- MACD golden cross confirmation (macdCrossUp = ta.crossover(macdLine, signalLine))
Sell conditions similarly:
- Price below EMA 200
- Hull condition satisfied (price below Hull or Hull line moving down)
- MACD death cross confirmation
The strategy also includes fixed take-profit and stop-loss settings: 10 points profit, 4 points stop-loss, embodying strict risk control principles.
Strategy Advantages
-
Multi-layer Confirmation Filtering System: By requiring aligned confirmation from three different indicators, the strategy significantly reduces false signals and noise, improving trading quality. The code's
buySignal = priceAboveEMA and hullConditionBuy and macdCrossUpdemonstrates this strict multi-confirmation mechanism. -
Trend and Momentum Integration: The strategy successfully combines the advantages of trend following (EMA 200) and momentum analysis (Hull and MACD), both identifying the major trend direction and capturing the best entry timing within the trend.
-
Response Speed Optimization: The adoption of the Hull Moving Average addresses the lag issue of traditional moving averages, providing faster response to trend changes. The complex calculation in the code
hull = ta.wma(2 * ta.wma(close, hullPeriod / 2) - ta.wma(close, hullPeriod), math.round(math.sqrt(hullPeriod)))is designed to achieve this goal. -
Clear Risk Management Framework: The built-in take-profit and stop-loss parameters (
tpPoints = 10andslPoints = 4.0) enforce disciplined risk management, effectively controlling drawdowns while pursuing returns. -
Visualization of Trading Signals: The strategy implements intuitive visualization of trading signals through the
plotshapefunction, enhancing user experience and operational convenience, helping traders quickly identify potential trading opportunities.
Strategy Risks
-
Signal Lag Issue: While the multi-confirmation mechanism improves reliability, it may also lead to relatively delayed entry signals, potentially missing some profits in rapidly changing markets. In particular, EMA 200 as a long-period indicator has more pronounced lag.
-
Fixed Take-Profit/Stop-Loss Parameter Limitations: The fixed take-profit (10 points) and stop-loss (4 points) parameters set in the code lack the ability to adapt to market volatility, potentially being too large or too small in different volatility environments, failing to optimize the risk-reward ratio.
-
Poor Performance in Oscillating Markets: In range-bound or trendless market environments, the strategy may generate frequent false signals, leading to consecutive losses. This is a common weakness of all trend-following strategies.
-
Inherent Indicator Lag: The three indicators used in the strategy (EMA, Hull, MACD) are inherently lagging indicators, calculated based on historical prices and unable to predict future price movements, potentially responding too late to sudden trend reversals.
-
Parameter Sensitivity: The strategy's effectiveness is highly dependent on the chosen indicator parameters, such as EMA 200 period, Hull 55 period, and MACD (12,26,9) parameters. Different markets and timeframes may require different parameter settings.
Strategy Optimization Directions
-
Adaptive Take-Profit/Stop-Loss Mechanism: Replace fixed-point take-profit and stop-loss with dynamic values based on ATR (Average True Range) or other volatility indicators, making risk management better adapt to current market conditions. The code can be modified to:
atrPeriod = 14 atrMultiplierTP = 2.5 atrMultiplierSL = 1.0 atrValue = ta.atr(atrPeriod) strategy.exit("Dynamic TP/SL", from_entry="BUY", profit=atrValue * atrMultiplierTP, loss=atrValue * atrMultiplierSL) -
Add Market Environment Filters: Add volatility or market state filters to avoid trading in oscillating markets. Consider adding the ADX indicator to assess trend strength or using Bollinger Band width to evaluate market volatility state.
-
Parameter Optimization and Adaptation: Conduct optimization tests on Hull Moving Average and EMA periods to find the optimal parameter combination. Furthermore, implement an adaptive parameter adjustment mechanism to dynamically adjust parameters based on different market conditions.
-
Incorporate Volume Confirmation: Introduce volume analysis to verify signal strength, ensuring trades are executed with sufficient market participation, improving signal quality.
-
Optimize Position Management: Transition from fixed-quantity trading to risk-percentage-based position management, making risk exposure more balanced for each trade. The code can be modified to determine trading quantity based on stop-loss distance and account risk ratio, rather than a fixed value.
Summary
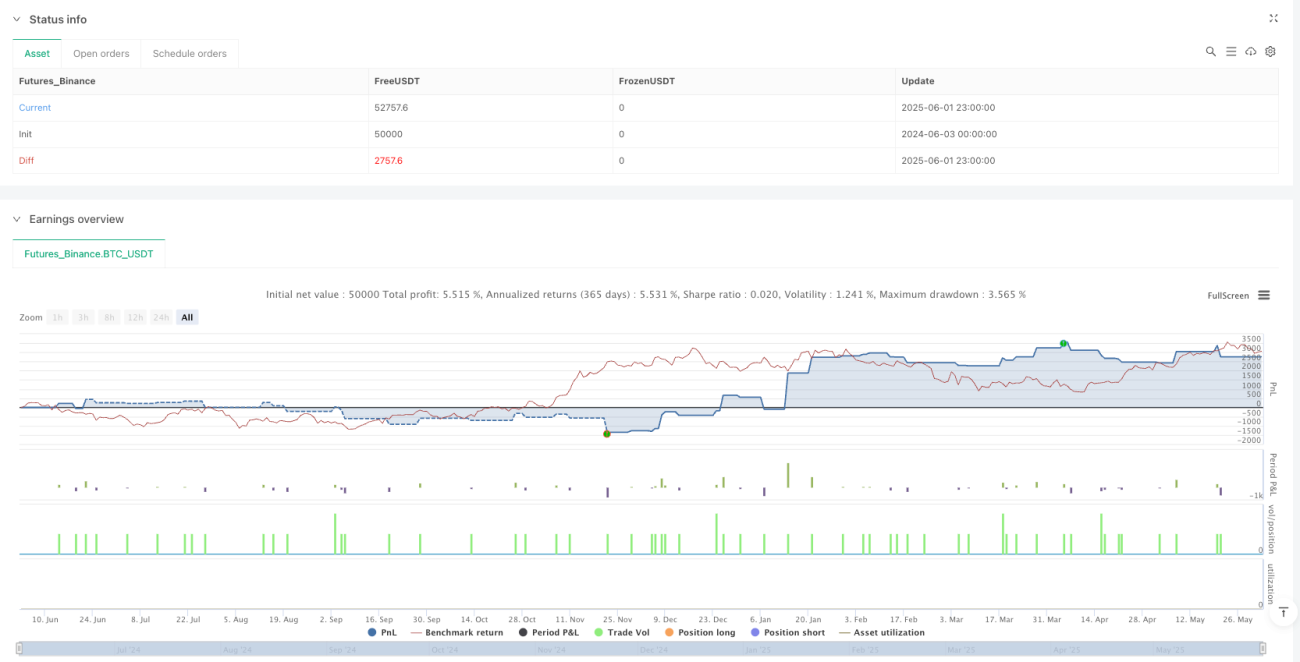
The Multi-Timeframe Momentum Confluence Trend Following Strategy constructs a powerful multi-layer confirmation trading system by integrating EMA 200, Hull Moving Average, and MACD indicators. The core advantage of this strategy lies in its strict multi-filtering mechanism, ensuring trades are only executed in high-probability trend environments, effectively reducing false signal risk. Through its three-layer logic of long-term trend direction assessment, medium-term momentum identification, and short-term signal triggering, the strategy can comprehensively evaluate market environments and capture optimal entry timing.
However, users should be aware of potential lag issues and performance limitations in oscillating markets. By introducing adaptive take-profit/stop-loss mechanisms, market environment filters, and optimized position management, the strategy's robustness and adaptability can be further enhanced. For quantitative investors pursuing trend trading, this strategy provides a structured, disciplined trading framework, helping them grasp trading opportunities with higher certainty in complex and changing markets.
- 1