
Overview
The Multi-EMA Trend Following Momentum Confirmation High-Leverage Quantitative Trading Strategy is a short-term trading system based on a combination of technical indicators, operating on a 5-minute timeframe with 20x leverage and a 30% profit target. The core logic of this strategy integrates multiple exponential moving averages (EMAs) for trend identification, Relative Strength Index (RSI) for momentum confirmation, Average Directional Index (ADX) for trend strength evaluation, and volume breakthrough verification to construct a multi-dimensional signal filtering system designed to capture high-probability short-term trading opportunities.
Strategy Principles
The core principles of this strategy are based on a collaborative confirmation mechanism of multiple technical indicators, specifically including:
-
Trend Identification System: The strategy uses three exponential moving averages of different periods (EMA20, EMA50, and EMA200) to form a trend judgment framework. When the short-term EMA20 is above the medium-term EMA50, and the medium-term EMA50 is above the long-term EMA200, an uptrend is confirmed; the opposite confirms a downtrend. This "triple alignment" method effectively filters market noise.
-
Trend Strength Assessment: The strategy evaluates trend strength using a uniquely calculated ADX indicator (greater than 25), ensuring trades are only executed in clear trends. The ADX calculation method is distinctive, employing four layers of RMA (Relative Moving Average) processing to create smoother, more stable signals.
-
Momentum Confirmation Mechanism: The RSI indicator serves as a momentum confirmation tool. In an uptrend, RSI must be greater than 55, while in a downtrend, RSI must be less than 45. This design sets stricter standards within the traditional RSI neutral zone (30-70), reducing false signals.
-
Volume Verification: The strategy requires current trading volume to exceed the 20-day average volume by 1.5 times, ensuring entries only occur with sufficient market participation, effectively avoiding risky trades in low-liquidity environments.
-
Price Confirmation: Long entries require the closing price to be greater than EMA20, while short entries require the closing price to be less than EMA20, serving as the final price confirmation condition.
Entry signals must simultaneously satisfy all the above conditions, forming a strict multi-layer filtering system.
The exit strategy employs preset take-profit and stop-loss mechanisms: take-profit is set at 1.5% of the entry price, and stop-loss is set at 0.75% of the entry price. With 20x leverage, these correspond to approximately a 30% account profit target and a maximum 15% account risk, respectively.
Strategy Advantages
-
Multiple Confirmation Mechanism: The multi-dimensional confirmation through trend, momentum, strength, and volume significantly improves the reliability of trading signals, reducing losses from false breakouts.
-
Clear Risk Management: The strategy incorporates precise take-profit to stop-loss ratios (1.5%:0.75%), creating a 2:1 risk-reward ratio that aligns with healthy trading risk management principles.
-
Leverage Effect Optimization: The parameter settings are specifically optimized for 20x leverage characteristics, allowing small price movements to generate significant account returns, suitable for short-term traders.
-
Volume Confirmation: Through volume breakthrough conditions, the strategy avoids risky trades in low-liquidity environments, improving execution quality.
-
Indicator Synergy Effect: The combined use of different types of indicators (trend, momentum, strength) allows for mutual verification, forming a more comprehensive market analysis framework.
-
Short Timeframe Advantage: Operating on 5-minute charts, the strategy offers more trading opportunities, higher capital utilization efficiency, and more timely returns.
Strategy Risks
-
High Leverage Risk: While 20x leverage can amplify returns, it equally amplifies losses. Even with stop-losses in place, actual losses may exceed the expected 15% during rapid market fluctuations or gaps. Solution: Consider reducing leverage or pausing trading in highly volatile market environments.
-
Short Timeframe Noise Interference: The 5-minute timeframe is susceptible to market noise, producing more false signals. Solution: Add trend filtering conditions from longer timeframes (e.g., 1-hour or 4-hour).
-
ADX Calculation Complexity: The four-layer nested calculation method for ADX is uniquely complex and may cause signals to be excessively smoothed, potentially missing trading opportunities. Solution: Simplify ADX calculation or adjust its threshold.
-
Fixed Stop-Loss and Take-Profit Limitations: Preset fixed percentage stop-loss and take-profit do not account for changing market volatility, potentially lacking flexibility in different market environments. Solution: Introduce an ATR-based dynamic stop-loss and take-profit mechanism.
-
Volume Dependency: Reliance on volume breakthrough may cause missed opportunities in markets with clear trends but low volume. Solution: Make volume conditions optional or adjust volume thresholds based on different market characteristics.
Strategy Optimization Directions
-
Dynamic Risk Management: Change fixed stop-loss and take-profit ratios to dynamic calculations based on ATR. ATR is already calculated in the code but unused. Stop-loss could be set at entry price ±(K×ATR), where K is a risk coefficient. This adapts risk according to actual market volatility, tightening stops in low-volatility markets and widening them in high-volatility markets.
-
Time Filter: Add trading time filtering to avoid high-volatility periods around market open and close, or to stop trading during specific low-liquidity periods for certain markets, improving signal quality.
-
Trend Strength Grading: Grade the ADX indicator (e.g., 25-35 for medium strength, >35 for high strength) and adjust position size or stop-loss/take-profit ratios according to different strength levels, achieving more refined risk management.
-
Multiple Timeframe Confirmation: Add trend confirmation conditions from higher timeframes (such as 15-minute or 1-hour), creating a timeframe linkage mechanism to reduce short-term false signals.
-
Partial Take-Profit Mechanism: Implement a staged take-profit strategy, for example, closing 50% of the position at a 0.75% price movement and holding the remainder until the 1.5% target. This approach maintains a high win rate while not missing opportunities from major market movements.
-
Improved ADX Calculation: Simplify the current complex four-layer nested RMA calculation method by using the standard ADX calculation method, maintaining trend strength evaluation functionality while reducing excessive lag issues.
-
Price Pattern Confirmation: Incorporate candlestick pattern analysis (such as engulfing patterns, doji stars, etc.) as additional confirmation signals to improve entry precision.
Conclusion
The Multi-EMA Trend Following Momentum Confirmation High-Leverage Quantitative Trading Strategy is a short-term trading system based on strict multiple technical indicator confirmations, particularly suitable for 5-minute timeframes and high-leverage environments. Its core strength lies in combining trend analysis, momentum confirmation, trend strength evaluation, and volume verification to form a comprehensive market analysis framework.
The strategy controls risk per trade through clear risk management mechanisms, maintaining a 2:1 risk-reward ratio, which theoretically provides good long-term expected value. However, traders must remain vigilant about the volatility associated with high leverage and short timeframes.
Future optimization directions primarily focus on dynamic risk management, multiple timeframe confirmation, and more refined position management. These improvements can further enhance the strategy's robustness and adaptability. Overall, this strategy provides short-term technical traders with a structured, disciplined trading framework, though it still requires continuous optimization and adjustment based on actual market performance.
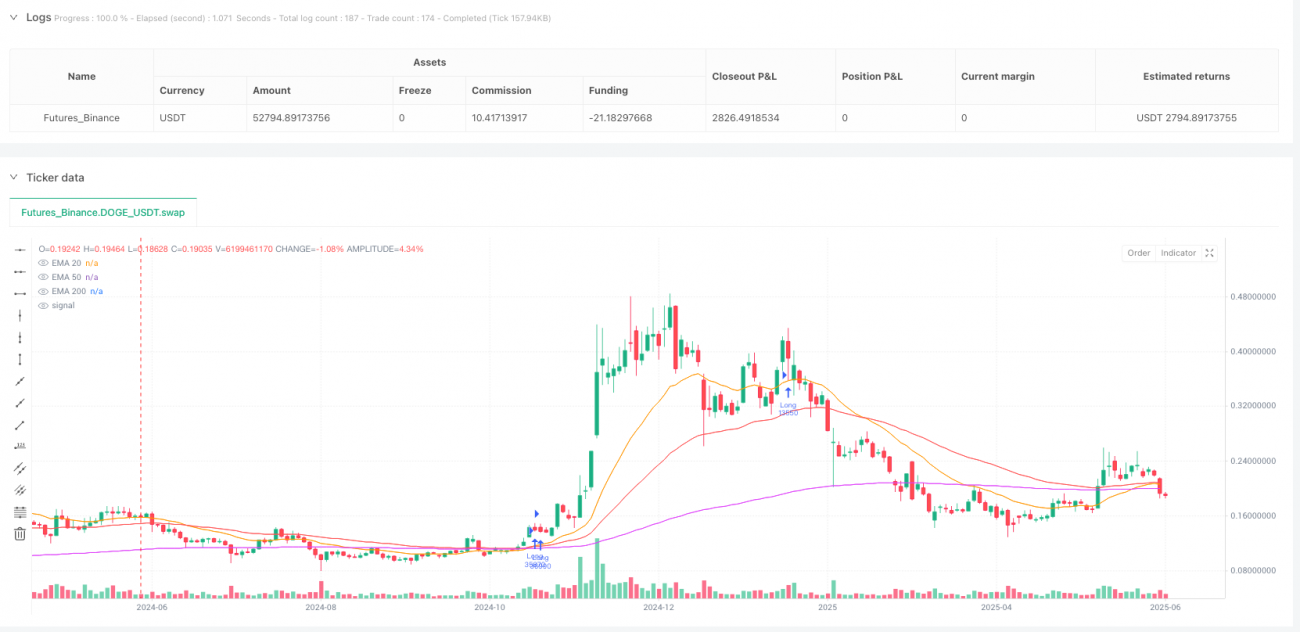
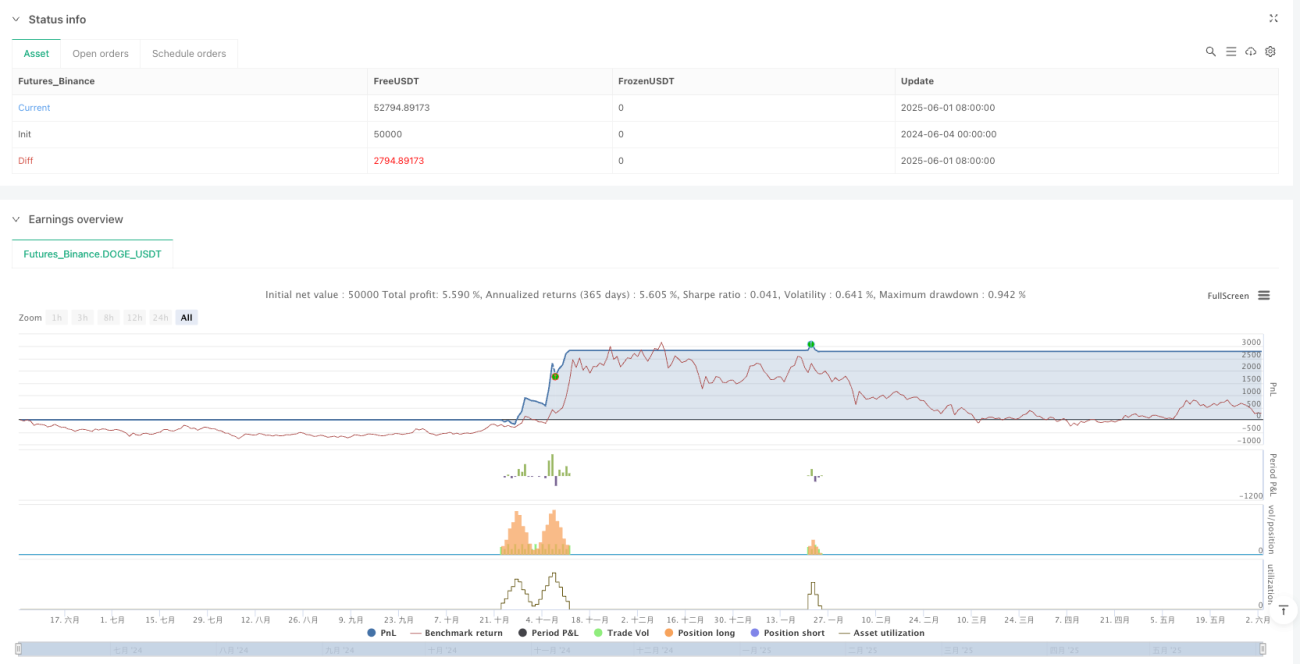
/*backtest
start: 2024-06-04 00:00:00
end: 2025-06-03 00:00:00
period: 2d
basePeriod: 2d
exchanges: [{"eid":"Futures_Binance","currency":"DOGE_USDT"}]
*/

//@version=5
strategy("5M x20 Leverage Strategy - 30% Target", overlay=true, default_qty_type=strategy.percent_of_equity, default_qty_value=10)

// === Indicators ===- 1