
Overview
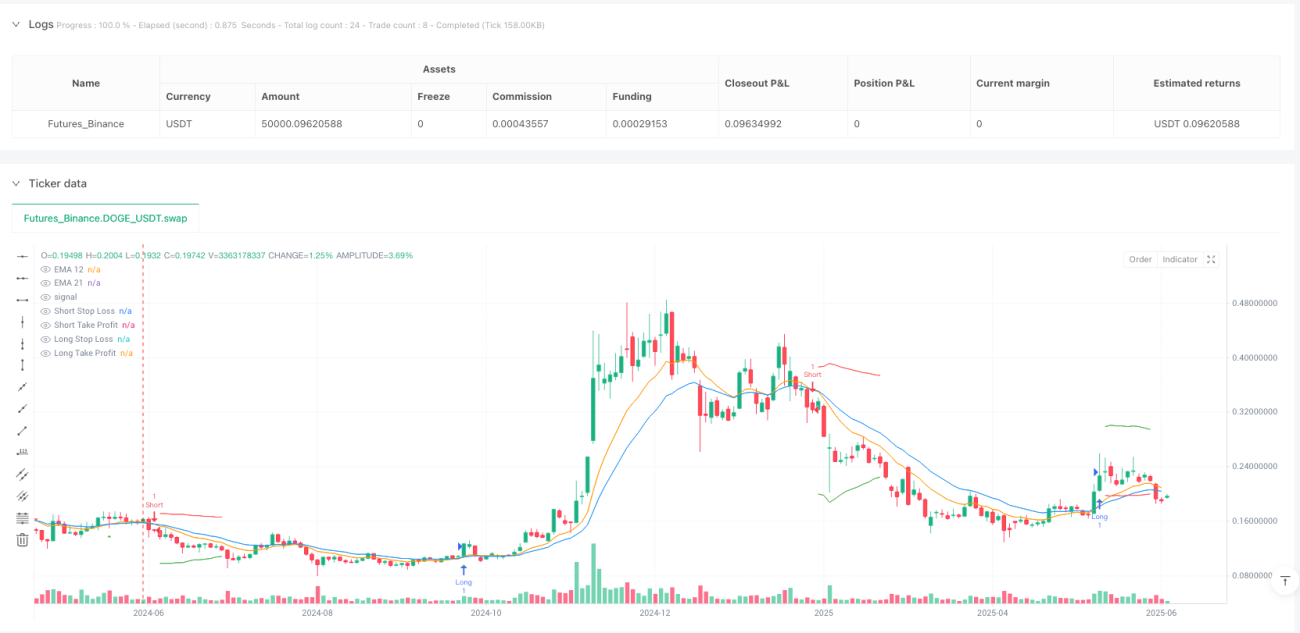
The Dynamic ATR-Based Stop-Loss and Take-Profit EMA Crossover Trend Quantification Strategy is a quantitative trading system based on short-term moving average crossover signals and volatility measurements. This strategy utilizes 12-period and 21-period Exponential Moving Averages (EMA) to generate entry signals, while employing Average True Range (ATR) to dynamically calculate stop-loss and take-profit levels, thereby automatically adjusting the risk-reward ratio. The system can capture market trend changes and filter out low-quality signals through a combination of technical indicators, enhancing strategy stability.
Strategy Principles
The core principle of this strategy is the combination of trend following and dynamic risk management. The specific execution logic is as follows:
-
Trend Identification: The strategy uses the crossover of 12-period EMA and 21-period EMA to determine market trend direction. When EMA12 crosses above EMA21, it indicates that short-term momentum exceeds medium-term momentum, triggering a long entry signal; when EMA12 crosses below EMA21, it triggers a short entry signal.
-
Risk Management: The strategy uses the 14-period ATR indicator to calculate market volatility and dynamically sets stop-loss and take-profit positions:
- Long Stop-Loss = Entry Price - ATR × 1.5
- Long Take-Profit = Entry Price + ATR × 3.0
- Short Stop-Loss = Entry Price + ATR × 1.5
- Short Take-Profit = Entry Price - ATR × 3.0
-
Strategy Execution: Once an entry signal is triggered, the system automatically opens a position in the corresponding direction and immediately sets ATR-based stop-loss and take-profit orders, requiring no manual intervention, achieving fully automated trading.
The strategy logic is clearly visible in the code: first calculating two EMA lines and the ATR indicator, then using ta.crossover and ta.crossunder functions to detect crossover events, and finally implementing dynamic stop-loss and take-profit settings through the strategy.exit function.
Strategy Advantages
Through in-depth code analysis, this strategy has several significant advantages:
-
Dynamic Risk Management: Unlike fixed-point stop-loss and take-profit, this strategy uses the ATR indicator to dynamically adjust risk parameters, allowing it to adapt to different market volatility environments. During high volatility periods, stop-loss and take-profit distances automatically increase; during low volatility periods, these distances automatically decrease, better aligning with actual market conditions.
-
Optimized Risk-Reward Ratio: In the strategy design, the take-profit multiplier (3.0) is greater than the stop-loss multiplier (1.5), ensuring a favorable risk-reward ratio (1:2), conducive to long-term profitability. Even with a win rate of only 50%, a positive mathematical expectation can still be maintained.
-
Simplicity and Efficiency: The strategy uses a classic combination of technical indicators, with low computational complexity and high execution efficiency, suitable for implementation on various trading platforms. Compared to complex multi-indicator strategies, it has fewer parameters, reducing the risk of overfitting.
-
Visual Presentation: The strategy includes comprehensive graphical rendering functions, plotting EMA lines, entry signals, and dynamic stop-loss and take-profit levels, allowing traders to intuitively understand the strategy's operational status.
-
Alert Functionality: The built-in alertcondition function helps traders capture trading signals in a timely manner, improving execution efficiency, especially suitable for traders who cannot monitor markets throughout the trading day.
Strategy Risks
Despite its many advantages, this strategy still has the following risk factors:
-
Moving Average Lag: As a lagging indicator, EMA may not respond in time when markets rapidly change direction, leading to suboptimal entry points or missed important turning points. Especially in consolidating markets, it may frequently produce false breakout signals, increasing trading costs.
-
Stop-Loss Risk: Although ATR dynamic stop-loss can adapt to market volatility, in extreme market conditions (such as gaps or flash crashes), actual stop-loss points may deviate significantly from expectations, leading to larger-than-expected losses.
-
Parameter Sensitivity: The choice of ATR multiplier and ATR period has a significant impact on strategy performance. Different markets and timeframes may require different parameter combinations, and parameter optimization may lead to overfitting historical data.
-
Lack of Trend Strength Filtering: The current strategy relies solely on EMA crossovers to determine trends, without additional trend strength confirmation mechanisms, potentially producing too many false signals in weak trend or oscillating markets.
-
Market Adaptability Limitations: This strategy performs well in strong trend markets but may not be effective in oscillating markets or sudden high-volatility environments, requiring appropriate adjustments for different market conditions.
Optimization Directions
Based on the above risk analysis, this strategy can be optimized in the following directions:
-
Add Trend Strength Filtering: Introduce ADX or similar indicators to assess trend strength, setting a minimum threshold (such as ADX>25) as an additional entry condition, filtering out low-quality signals in weak trend environments, and reducing frequent trading in oscillating markets.
-
Add Pullback Confirmation: After an EMA crossover, add a mechanism to wait for price pullbacks to the EMA for confirmation, avoiding entries at overextended positions, improving entry point quality. For example, RSI indicator or percentage distance between price and EMA can be used to optimize entry timing.
-
Dynamically Adjust Risk Parameters: Based on changes in market volatility or historical volatility percentiles, dynamically adjust ATR multipliers, reducing risk exposure in high-volatility environments and appropriately increasing position size in low-volatility environments.
-
Introduce Time Filtering: Add trading time window filtering functions to avoid low-liquidity periods and high-volatility periods before and after major data releases, reducing unnecessary risk exposure.
-
Optimize Take-Profit Strategy: Consider implementing a partial take-profit mechanism, or introducing trailing stops (such as tracking the highest/lowest point by ATR multiples), preserving some profit potential while securing existing gains.
-
Add Volume Confirmation: Use trading volume as an auxiliary confirmation indicator for trading signals, executing trades only when volume significantly increases, improving signal quality.
Summary
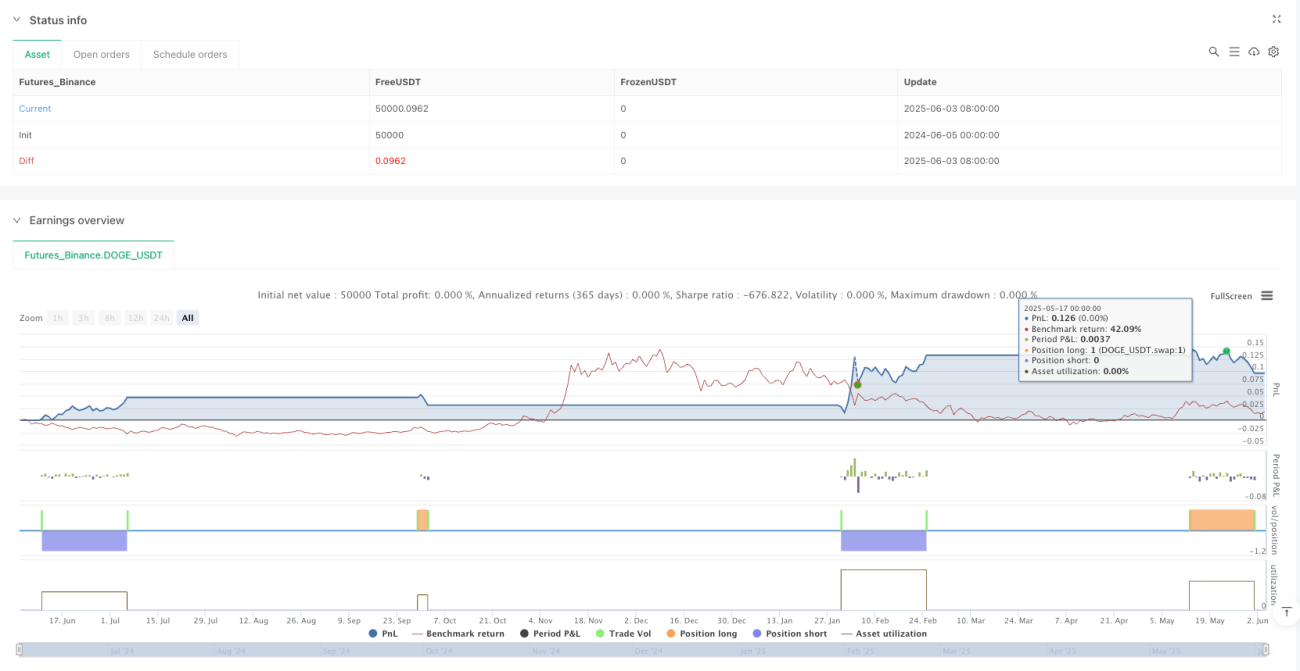
The Dynamic ATR-Based Stop-Loss and Take-Profit EMA Crossover Trend Quantification Strategy is a quantitative trading system combining trend following and dynamic risk management. This strategy uses EMA crossovers to capture market trend turning points and dynamically adjusts stop-loss and take-profit levels through the ATR indicator, achieving automatic optimization of the risk-reward ratio.
The main advantages of this strategy lie in its simple and efficient design and dynamic risk management mechanism, which can self-adapt to different market volatility environments. However, as a trend-following strategy based on moving averages, its performance may be poor in oscillating markets, and there is a certain lag risk.
By introducing trend strength filtering, pullback confirmation, dynamic risk parameter adjustment, and other optimization measures, the stability and adaptability of the strategy can be further enhanced. For quantitative traders, this strategy provides a good starting point that can be customized and expanded according to personal risk preferences and trading objectives.
Regardless of which optimization approach is adopted, traders should conduct thorough backtesting verification before real-world application and continuously adjust and refine strategy parameters in conjunction with changing market environments to achieve long-term stable trading performance.
- 1