
Overview
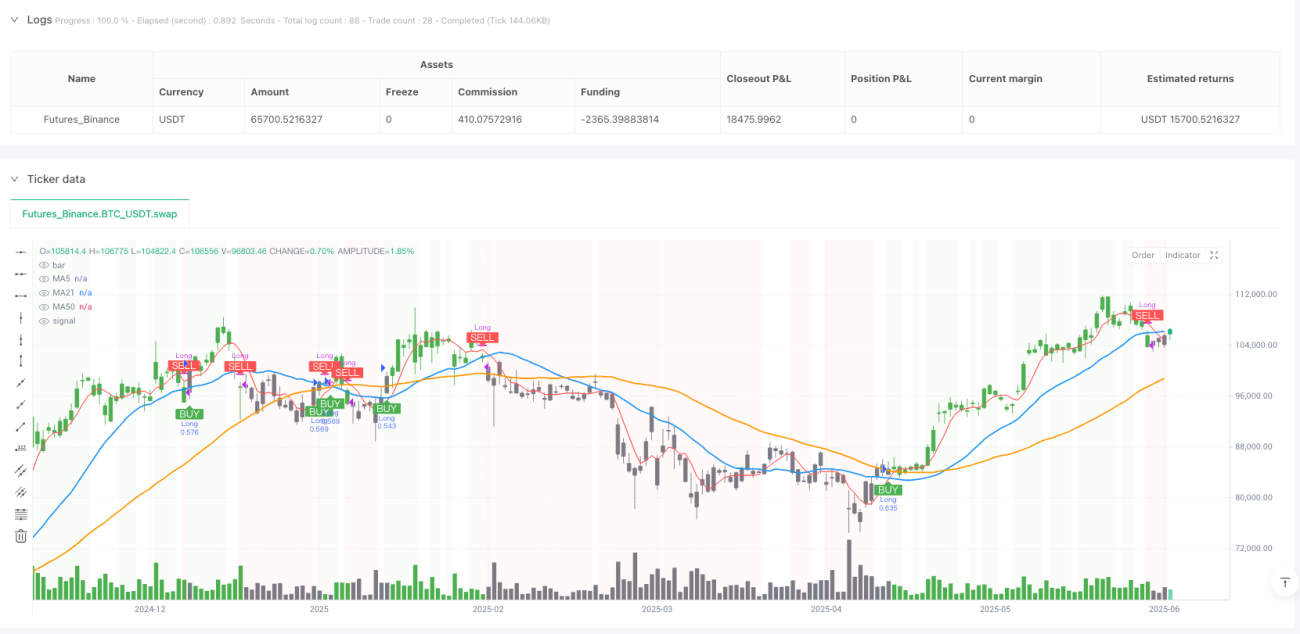
The Triple Moving Average Trend Following Quantitative Strategy is a trading system based on multiple-period moving averages, which identifies trend direction and executes trades by monitoring the relative position of price against the 5-day, 21-day, and 50-day Simple Moving Averages (SMA). This strategy follows the "trend following" philosophy, establishing long positions during strong upward trends and closing positions when the trend weakens, to capture mid to long-term price movements. The strategy logic is straightforward: enter long when price rises above all three moving averages, and exit completely when price falls below the 21-day moving average, thus providing effective trend confirmation and risk control mechanisms while maintaining simplicity.
Strategy Principles
The core principle of this strategy is to utilize a combination of different period moving averages to filter market noise and confirm trend strength. Specifically:
-
Multiple Timeframe Confirmation: By combining short-term (5-day), medium-term (21-day), and long-term (50-day) moving averages, the strategy can confirm trend robustness from multiple time dimensions.
-
Entry Logic: The entry condition requires the price to be simultaneously higher than all three moving averages (5-day, 21-day, and 50-day SMA), which is a reliable indicator of a strong upward trend, indicating that short, medium, and long-term momentum are all pointing upward. This strict entry condition effectively reduces false signals.
-
Exit Logic: When the price falls below the 21-day moving average, it triggers a position closing signal. As a medium-term trend indicator, a price drop below this line usually means that the upward trend may have weakened or reversed.
-
Position Management: The strategy adopts a 100% capital allocation ratio, entering with full position when conditions are met, reflecting high confidence in the signal.
-
Transaction Cost Consideration: The strategy sets a commission ratio of 0.1% and 3 points slippage, which is closer to the real trading environment, increasing the reliability of the backtest results.
-
Date Range Filter: Trades are only executed within the set time range (January 1, 2018, to June 3, 2025), allowing the strategy to be tested and optimized within specific market cycles.
Strategy Advantages
-
Simple and Effective: The strategy rules are simple and clear, easy to understand and execute, reducing the risk of overfitting while providing good trend capturing capabilities.
-
Multiple Confirmation Mechanism: By requiring price to simultaneously break through three different period moving averages, false signals are significantly reduced, improving trading quality.
-
Following the Trend: The strategy fully adheres to the principle that "trend is your friend," only holding positions in confirmed strong upward trends, avoiding the risks associated with counter-trend trading.
-
Clear Risk Control: The 21-day moving average serves as a stop-loss point, providing a clear risk management framework to prevent small pullbacks from becoming significant losses.
-
Visual Feedback: The strategy provides rich visual feedback through background colors, bar colors, and trade markers, facilitating real-time monitoring and retrospective analysis.
-
Capital Efficiency: The full position operation mode maximizes capital utilization after trend confirmation, helping to obtain maximum returns in strong market conditions.
-
Adaptability: Although the default parameters are set to 5, 21, and 50 days, these moving average periods can be adjusted according to different market characteristics and trader preferences, enhancing the strategy's adaptability.
Strategy Risks
-
Trend Reversal Risk: In the case of a sudden reversal of a strong trend, the price may quickly fall below the 21-day moving average, resulting in significant losses. To mitigate this risk, consider adding more sensitive stop-loss mechanisms, such as volatility percentage stops or ATR stops.
-
Full Position Risk: While a 100% capital allocation strategy can maximize returns, it also amplifies the risk of each trade. It is recommended to adjust position size according to personal risk tolerance or implement a phased position building strategy.
-
Lag Problem: As lagging indicators, moving averages may not respond quickly enough during rapid market changes, leading to delayed entry or exit signals. This can be improved by introducing dynamic periods or Exponential Moving Averages (EMA) to increase response speed.
-
Frequent Trading Risk: In sideways consolidating markets, prices may frequently cross the 21-day moving average, resulting in multiple ineffective trades and commission erosion. This can be reduced by adding filtering conditions such as volume confirmation or volatility filtering.
-
Parameter Sensitivity: Strategy performance is sensitive to the chosen moving average periods. Inappropriate parameter selection may lead to overfitting or decreased signal quality. It is recommended to determine the optimal settings through multi-period, multi-market parameter optimization and robustness testing.
-
Poor Performance in Range-Bound Markets: In sideways markets with no obvious trend, this strategy may generate numerous false signals, leading to losses. Consider adding trend strength filters, such as the ADX indicator, to pause trading in non-trending markets.
Strategy Optimization Directions
-
Add Volume Confirmation: Incorporate volume analysis into entry and exit conditions to ensure that price breakouts or breakdowns are supported by sufficient market participation. For example, require that the volume during a breakout is higher than the average volume of the previous N days.
-
Adaptive Parameter Settings: Dynamically adjust moving average periods based on market volatility conditions, using longer periods in high volatility environments to reduce noise and shorter periods in low volatility environments to increase sensitivity. This adjustment can be implemented using the ATR indicator.
-
Add Trend Strength Filter: Introduce ADX or similar indicators to evaluate trend strength, only executing trades when the trend is clear, avoiding frequent trading in sideways markets.
-
Phased Position Building and Closing: Change the 100% capital allocation to a phased operation mode, gradually establishing or reducing positions as different conditions are met, both reducing risk and optimizing average cost.
-
Add Take-Profit Mechanism: Set take-profit points based on ATR multiples or important resistance levels to lock in partial profits and improve the risk-reward ratio.
-
Multi-Timeframe Analysis: Combine trend analysis from higher timeframes, only trading when daily and weekly trends align, improving accuracy in capturing major trends.
-
Drawdown Protection Optimization: Add drawdown protection mechanisms in strong upward trends, such as partially closing positions when the price falls a specific percentage from the high, protecting already gained profits.
-
Sentiment Indicator Supplement: Combine oscillating indicators like RSI to identify overbought and oversold conditions, avoiding entry during extreme sentiment periods to reduce reversal risk.
Summary
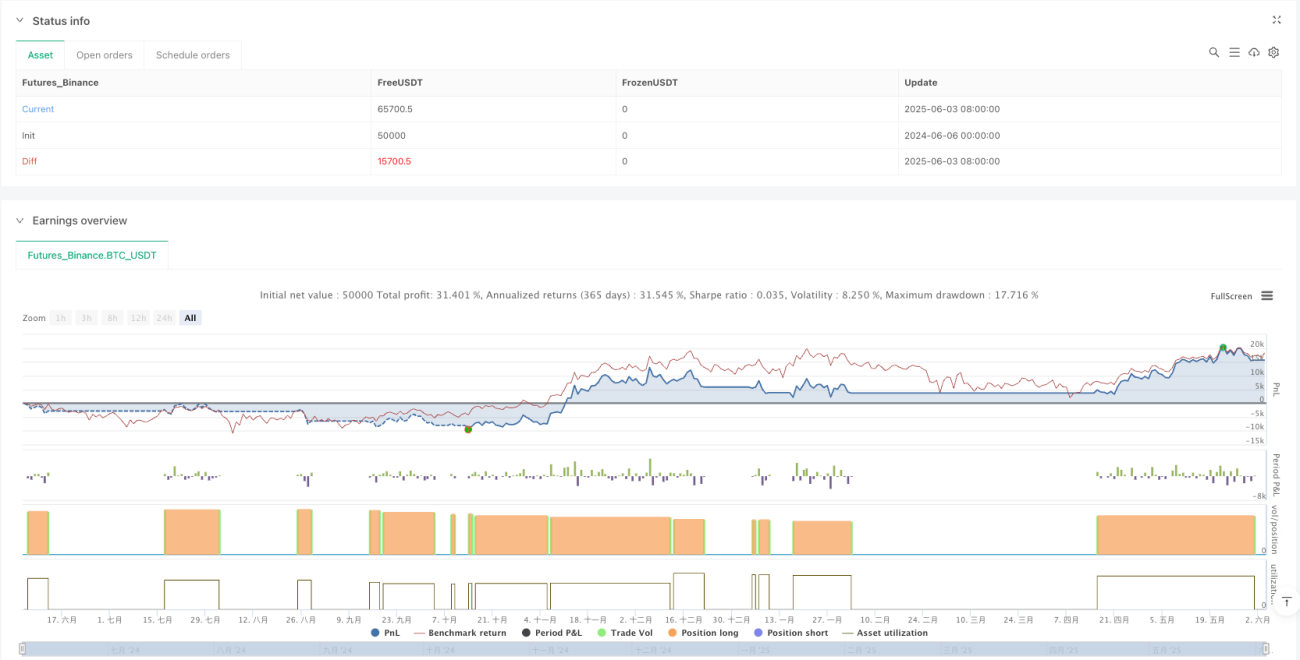
The Triple Moving Average Trend Following Quantitative Strategy is a clearly structured, logically rigorous trend following system that effectively identifies and participates in strong upward trends through the collaborative confirmation of multiple-period moving averages. The strategy's greatest advantage lies in the balance between simplicity and reliability, avoiding the overfitting risk brought by excessive complexity while improving signal quality through multiple confirmation mechanisms. Its clear entry and exit rules make the execution process objective and consistent, reducing emotional interference.
However, as a trend following system, this strategy may face challenges in sideways markets, and the full position operation mode increases the risk of individual trades. Through the suggested optimization directions, especially adding volume confirmation, trend strength filtering, and dynamic parameter adjustment, the strategy's robustness and adaptability can be further enhanced. Meanwhile, phased operations and more flexible capital management plans can improve risk control.
Overall, the Triple Moving Average Trend Following Quantitative Strategy provides mid to long-term investors with a structured framework to help them establish positions when trends are confirmed and exit promptly when trends weaken, realizing the trading concept of "following the trend." With reasonable parameter settings and continuous optimization, this strategy has the potential to maintain stable performance in various market environments.
/*backtest
start: 2024-06-06 00:00:00
end: 2025-06-04 08:00:00
period: 1d
basePeriod: 1d
exchanges: [{"eid":"Futures_Binance","currency":"BTC_USDT"}]
*/

//@version=6
strategy(title="Claude - 21 Trend Strategy", overlay=true, commission_type=strategy.commission.percent, commission_value=0.1, slippage=3, default_qty_type=strategy.percent_of_equity, default_qty_value=100)
- 1