
Overview
The Multi-Confirmation Price Reversal Strategy is a quantitative trading system that combines candlestick pattern analysis and momentum indicators. This strategy primarily captures potential market reversal points by identifying Engulfing Patterns in the market and confirming them with MACD crossovers. The core philosophy is to enhance trading signal reliability through multiple technical confirmations, thereby reducing the risk of false breakouts. Specifically, the strategy first identifies an engulfing pattern (bullish or bearish), then waits for the corresponding MACD crossover within a preset window period (default 3 bars). Only when both conditions are met does the strategy trigger an entry signal while closing any opposite positions.
Strategy Principles
The strategy's working mechanism revolves around two core technical analysis elements: the Engulfing Pattern and MACD indicator crossovers.
-
Engulfing Pattern Identification:
- Bullish Engulfing: The current candle is bullish (close > open), the previous candle is bearish (close[1] < open[1]), and the current candle's body completely "engulfs" the previous candle's body (open < close[1] and close > open[1]).
- Bearish Engulfing: The current candle is bearish, the previous candle is bullish, and the current candle's body completely "engulfs" the previous candle's body.
-
MACD Crossover Confirmation:
- MACD line and signal line are calculated using the standard formula: with fast EMA (default 12 periods), slow EMA (default 26 periods), and signal line EMA (default 9 periods).
- Bullish MACD crossover: MACD line crosses above the signal line.
- Bearish MACD crossover: MACD line crosses below the signal line.
-
Time Window Logic:
- The strategy uses
barsSinceBullandbarsSinceBearvariables to track the number of bars since the last engulfing pattern. - A trading signal is only triggered when the MACD crossover occurs within
windowBars(default 3) bars after the engulfing pattern appears.
- The strategy uses
-
Entry Conditions:
- Long entry (
longCondition): MACD line crosses above the signal line within the window period after a bullish engulfing pattern appears. - Short entry (
shortCondition): MACD line crosses below the signal line within the window period after a bearish engulfing pattern appears.
- Long entry (
-
Trade Execution:
- When the long condition is met, the strategy enters a long position and closes any existing short positions.
- When the short condition is met, the strategy enters a short position and closes any existing long positions.
Strategy Advantages
-
Multiple Confirmation Mechanism: By combining candlestick patterns and technical indicators, the strategy reduces the possibility of false signals and improves trading accuracy. The engulfing pattern represents direct price action, while MACD represents momentum, together confirming market reversal signals from different angles.
-
Time Window Flexibility: The strategy allows users to customize the maximum number of bars (
windowBarsparameter) within which the MACD crossover must occur after the engulfing pattern. This flexibility enables the strategy to adapt to different markets and timeframes. -
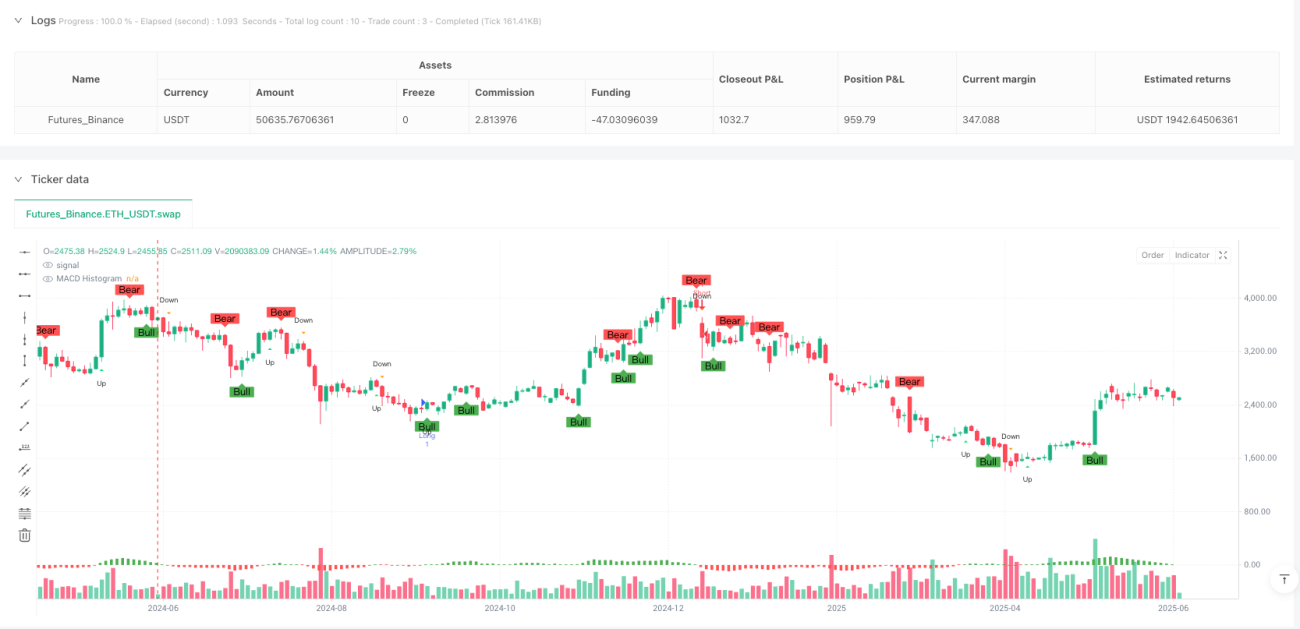
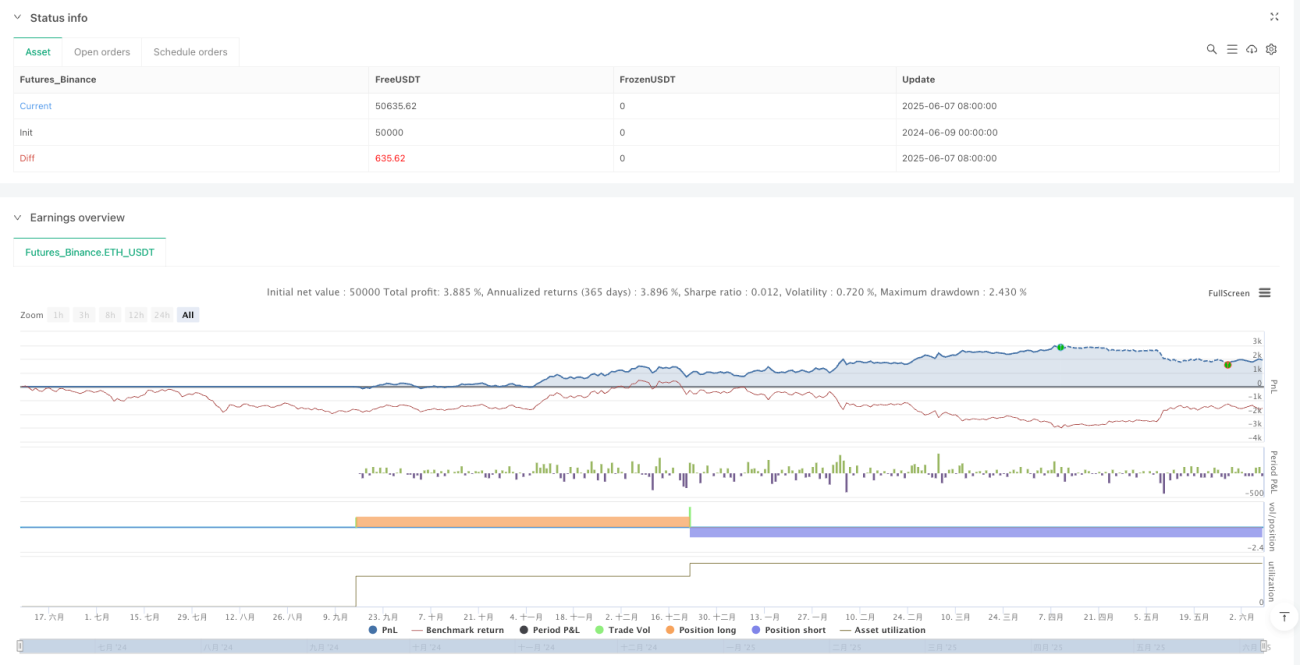
Clear Visual Feedback: The strategy marks various signals on the chart (bullish/bearish engulfing patterns, MACD crossovers, and actual entry points), helping traders visually understand and evaluate the strategy's performance.
-
Automated Position Management: The strategy automatically handles the closing of opposite positions, simplifying trade management and reducing the possibility of human error.
-
Parameter Adjustability: MACD parameters (fast, slow, and signal line periods) can be optimized for different market conditions, enhancing the strategy's adaptability.
Strategy Risks
-
Lag Risk: As a lagging indicator, MACD may not respond promptly in rapidly changing markets, leading to suboptimal entry points. Additionally, waiting for both conditions to be satisfied may further delay entry points, potentially missing part of the price movement.
-
Poor Performance in Ranging Markets: In ranging markets without clear trends, engulfing patterns and MACD crossovers may generate numerous false signals, leading to frequent trading and potential losses.
-
Lack of Stop Loss Mechanism: The current strategy implementation lacks an explicit stop loss mechanism, which may result in significant downside risk during market reversals.
-
Over-reliance on Specific Patterns: The strategy heavily depends on the combination of engulfing patterns and MACD crossovers, while ignoring other potentially important market information and technical indicators.
-
Parameter Sensitivity: Strategy performance may be highly sensitive to MACD parameters and window size settings. Inappropriate parameter selection may lead to over-optimization and poor future performance.
Optimization Directions
-
Add Trend Filters: Implement trend indicators such as SMA50 (already commented in the code) or others to ensure trade direction aligns with the primary trend, for example, only going long when price is above SMA50 and short when below. This can significantly reduce counter-trend trading risks.
-
Implement Stop Loss and Take Profit Mechanisms: Add stop loss orders and profit targets to the strategy, such as ATR-based stop losses or support/resistance-based profit targets, to better manage risk and lock in profits.
-
Optimize Parameter Selection: Conduct backtesting optimization for MACD parameters and window size to find the optimal parameter combinations for specific markets and timeframes. Consider using adaptive parameter methods that automatically adjust parameters based on market volatility.
-
Add Volume Confirmation: Incorporate volume analysis into the strategy to ensure reversal signals are supported by sufficient trading volume, thereby increasing signal reliability.
-
Integrate Other Indicators: Consider adding other technical indicators such as RSI, Stochastic, or Bollinger Bands to create more comprehensive trading conditions and further reduce false signals.
-
Time Filters: Implement trading time filters to avoid trading during important economic data releases or periods of particularly high market volatility.
-
Optimize Entry Timing: Research whether entry conditions can be improved (such as waiting for pullbacks or price confirmation) to enhance entry prices and reduce potential slippage.
Summary
The Multi-Confirmation Price Reversal Strategy is a quantitative trading system combining engulfing patterns and MACD crossovers, designed to capture market reversal points through multiple technical indicator confirmations. The strategy's main advantages lie in its multiple confirmation mechanism and clear visual feedback, which help reduce false signals and improve trading accuracy. However, the strategy also has inherent risks, such as lag, poor performance in ranging markets, and lack of explicit risk management mechanisms.
To enhance the strategy's robustness and profitability, several key optimizations are recommended: adding trend filters to ensure trade direction aligns with the primary trend; implementing appropriate stop loss and take profit mechanisms to manage risk; optimizing MACD parameters and window size to adapt to specific market conditions; and considering the integration of other technical indicators to create more comprehensive trading conditions. Through these optimizations, traders can significantly improve the strategy's performance, reduce risk, and adapt to different market environments.
This multi-layered confirmation approach represents a balanced trading strategy that attempts to capture potential reversal opportunities while reducing risk by requiring multiple confirmations. For quantitative traders seeking to build robust trading systems based on technical analysis, this provides a solid starting point.
- 1