
Overview
This strategy is a multi-indicator collaborative trading system based on daily charts that cleverly combines price action, multi-period moving average systems, Relative Strength Index (RSI), Average Directional Index (ADX), and volume filters. It aims to find high-probability pullback entry points in strong trend environments. Specifically designed for trend trading on the daily timeframe, the strategy uses multi-level filtering conditions to ensure trading only occurs when the market has a clear direction, effectively avoiding frequent false signals in oscillating markets.
Strategy Principles
The core logic of this strategy is based on a multi-level condition filtering system, with specific operating principles as follows:
-
Trend Confirmation System: The strategy first requires the price to be above the long-term trend moving average (100-day EMA), and the mid-term trend moving average (50-day EMA) to also be above the long-term average, confirming a strong uptrend. For short trades, the opposite conditions are required.
-
Pullback Entry Mechanism: After confirming the trend, the strategy looks for price pullbacks to the fast moving average (10-day EMA) and waits for the price to break back above this average from below, forming a clear entry signal.
-
RSI Momentum Confirmation: Before entry, the RSI indicator is required to be above a set threshold (default 55) to ensure the market maintains sufficient upward momentum. Short trades require the RSI to be below a set threshold (default 45).
-
ADX Trend Strength Filter: The strategy uses a custom-calculated ADX indicator and only allows trading when the ADX is above a specified threshold (default 20), effectively filtering out weak trends or sideways markets.
-
Volume Confirmation: To further improve trade quality, the strategy requires that the entry volume is higher than the 20-day average volume, ensuring that there is sufficient market participation to support the price movement.
-
Risk Management System: The strategy employs a dynamic stop-loss and take-profit setting based on ATR, and supports trailing stops for precise risk control. The stop-loss is defaulted to 1.5 times ATR, take-profit at 3 times ATR, with trailing stop steps at 1 times ATR.
Strategy Advantages
Through deep analysis of the strategy code, we can summarize the following distinct advantages:
-
Multi-level Filtering System: By combining moving averages, RSI, ADX, and volume multiple filtering conditions, this strategy significantly improves the quality of trading signals and reduces the generation of false signals.
-
Trend and Momentum Synergy: The strategy not only focuses on price trends but also confirms market momentum and trend strength through RSI and ADX, achieving a dual "trend-momentum" confirmation mechanism.
-
Flexible Parameter Customization: The strategy provides rich parameter setting options, including moving average periods, RSI thresholds, ADX thresholds, volume multipliers, etc., allowing users to flexibly adjust according to different market environments.
-
Comprehensive Risk Management: The ATR-based dynamic stop-loss and take-profit system, coupled with an optional trailing stop mechanism, provides the strategy with a scientific risk control framework, effectively controlling the risk exposure of each trade.
-
Market Environment Adaptability: Through ADX filtering, the strategy can automatically identify and avoid oscillating markets, only participating in trades during clear trends, significantly improving the strategy's adaptability in different market environments.
Strategy Risks
Despite being well-designed, this strategy still has the following potential risks and challenges:
-
Parameter Sensitivity: The strategy relies on multiple indicator parameters, and different parameter combinations may lead to significant performance differences. Over-optimization may lead to future performance decline. The solution is to conduct extensive parameter robustness testing and avoid overfitting historical data.
-
Trend Reversal Risk: In cases of sudden reversal of strong trends, the strategy may still face significant losses despite multiple filtering conditions. It is recommended to combine higher timeframe trend confirmation or add trend reversal early warning mechanisms.
-
Signal Scarcity: Due to the adoption of multiple strict filtering conditions, the strategy may not generate trading signals for extended periods, resulting in low capital utilization. Consider appropriately relaxing certain condition parameters while maintaining the core logic.
-
Stop-Loss Breakthrough Risk: In cases of significant market fluctuations or insufficient liquidity, ATR-based fixed stop-losses may not execute as expected. Consider adding time condition filtering or market volatility monitoring mechanisms.
-
Backtest vs. Real Trading Differences: The strategy's performance in backtesting may differ from real trading, especially considering factors like slippage and trading costs. It is recommended to conduct paper trading tests before live trading and initially use smaller capital amounts for verification.
Strategy Optimization Directions
Based on in-depth analysis of the strategy code, here are several possible optimization directions:
-
Multi-timeframe Confirmation: Introduce higher timeframe (such as weekly or monthly) trend confirmation, allowing trades only when trends across multiple timeframes are consistent, improving the reliability of trend judgments.
-
Volatility Adaptive Parameters: Dynamically link key parameters such as stop-loss distance and trailing stop steps with market volatility, enabling the strategy to automatically adapt to different market volatility environments.
-
Machine Learning Optimization: Utilize machine learning technology to dynamically adjust strategy parameters or weights, enabling the strategy to better adapt to market environment changes and improve long-term stability.
-
Fundamental Analysis Filtering: For digital asset trading, consider introducing on-chain data or market sentiment indicators as additional filtering conditions to further improve signal quality.
-
Partial Position Management: Implement a dynamic position management system that automatically adjusts the position size of each trade based on signal strength, market volatility, and account profit/loss status, optimizing capital efficiency and risk-reward ratio.
-
Extended Take-Profit Strategy: Implement multi-level take-profit strategies, such as batch profit-taking or dynamic take-profit based on market structure, improving the strategy's profitability and win rate.
Summary
The Trend Momentum Confirmation Multi-Indicator Trading Strategy is a well-designed trading system that effectively captures high-probability trading opportunities in the market by combining price action, moving average systems, RSI momentum confirmation, ADX trend strength filtering, and volume confirmation. This strategy is particularly suitable for finding pullback entry opportunities in clear trend markets, achieving high signal quality and risk control capabilities through strict condition filtering and comprehensive risk management.
Although the strategy faces challenges such as parameter sensitivity, trend reversal risk, and signal scarcity, through the suggested optimization directions like multi-timeframe confirmation, volatility adaptive parameters, machine learning optimization, fundamental filtering, and dynamic position management, the strategy has the potential to further enhance its stability and adaptability. Overall, this strategy provides traders with a systematic, disciplined trading framework that helps maintain objective and rational trading decisions in complex and changing market environments.
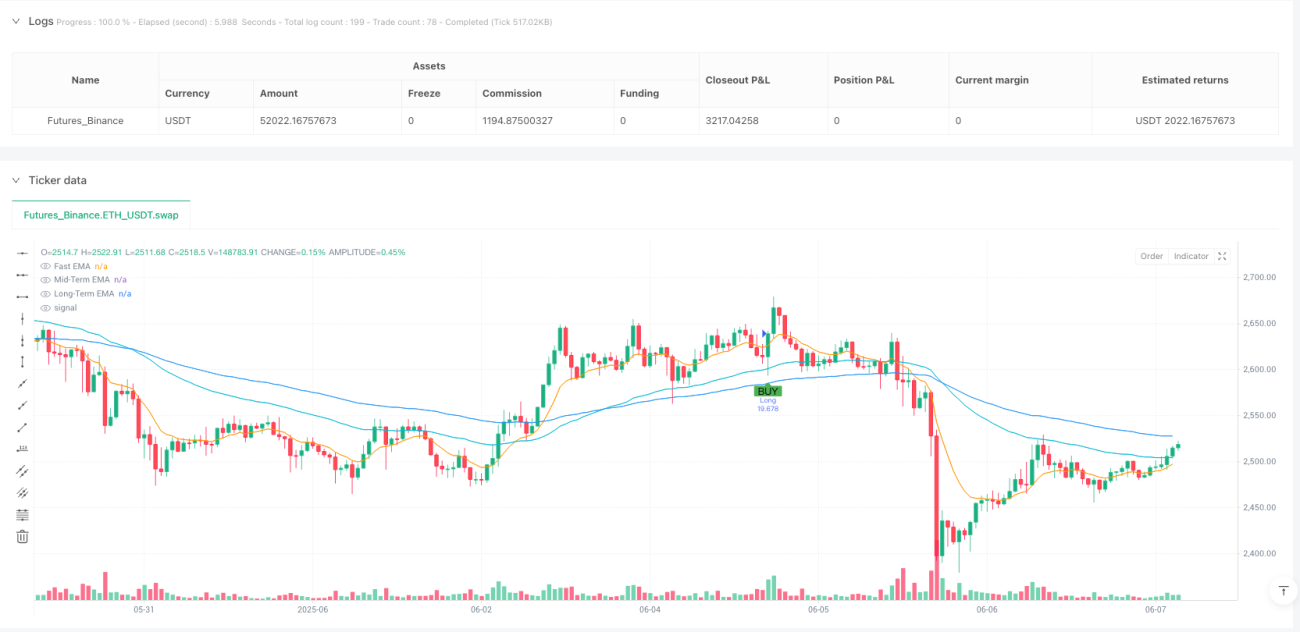
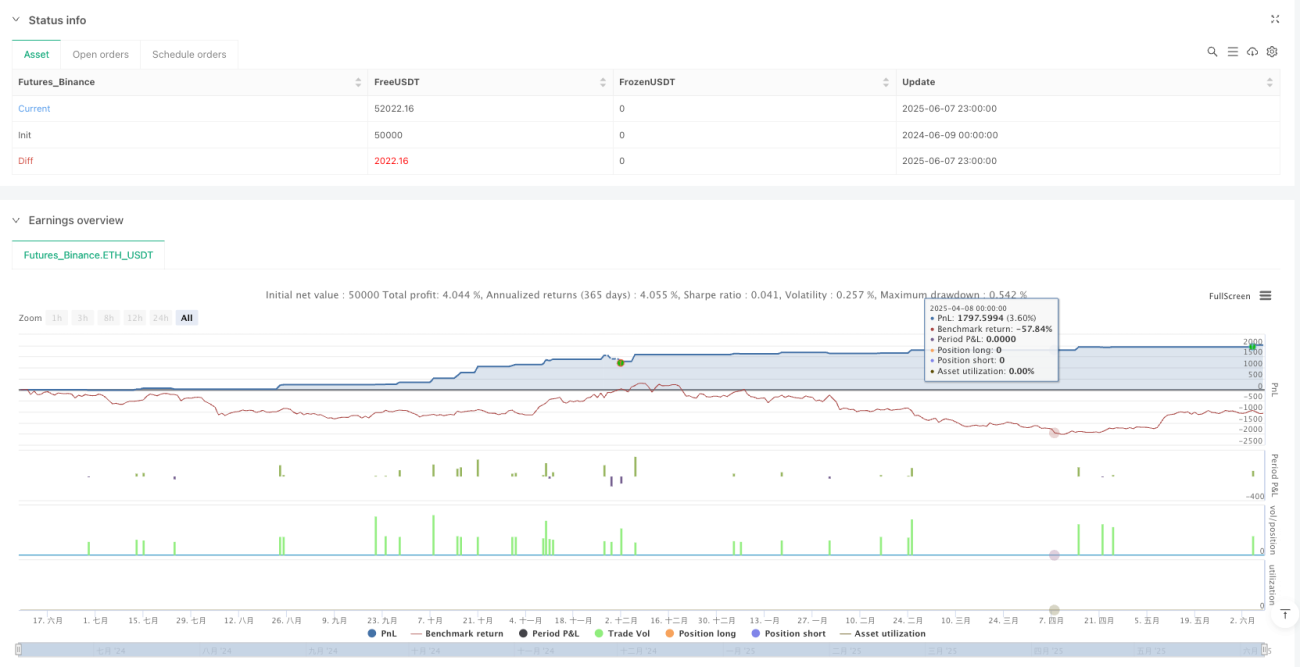
/*backtest
start: 2024-06-09 00:00:00
end: 2025-06-08 00:00:00
period: 1h
basePeriod: 1h
exchanges: [{"eid":"Futures_Binance","currency":"ETH_USDT"}]
*/

//@version=5
strategy("JonnyBtc Daily Pullback Strategy (Volume + ADX)", overlay=true, default_qty_type=strategy.percent_of_equity, default_qty_value=100)

// === INPUTS ===- 1