Bollinger Band Pinbar Mean-Reversion Quantitative Strategy with Dual Target Optimization

Overview
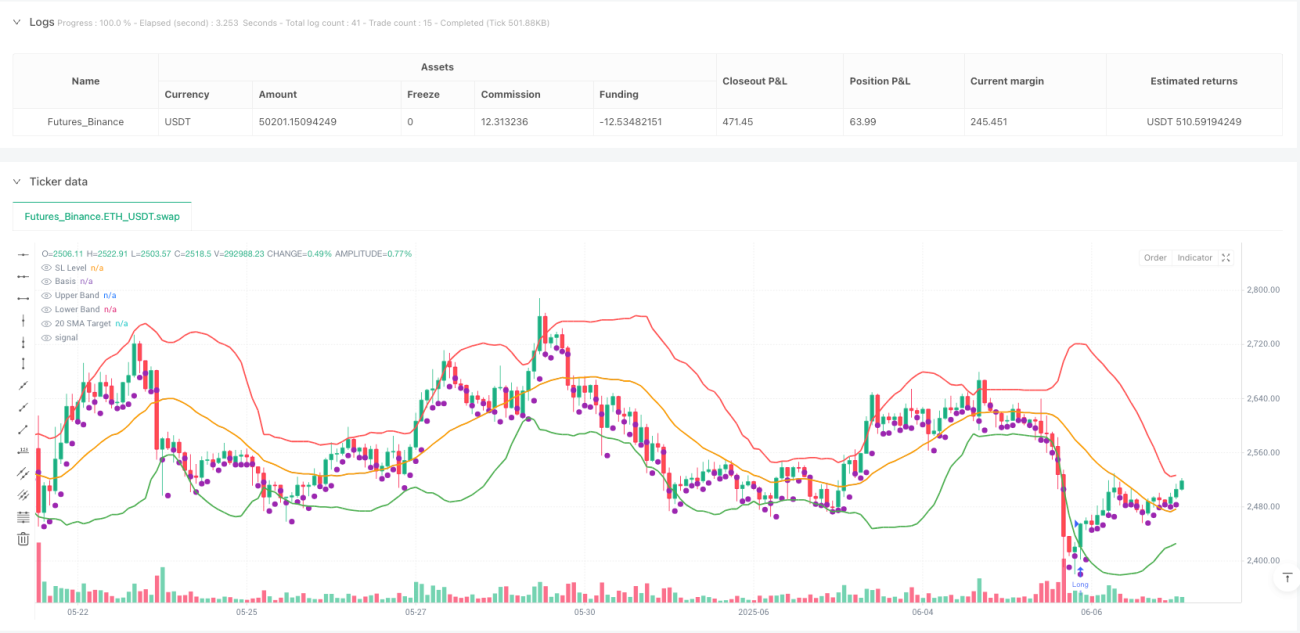
The Bollinger Band Pinbar Mean-Reversion Quantitative Strategy with Dual Target Optimization is a technical analysis-based trading system that combines Bollinger Bands indicators with price action pattern analysis. This strategy focuses on identifying potential reversal points in oversold market areas by capturing the process of price regression from the lower Bollinger Band towards the mean (20-period SMA) or even the upper band. The core logic revolves around the "pinbar pattern" - when the previous day's high is below the lower Bollinger Band while the current day's closing price returns inside the band, typically indicating a potential trend reversal. The strategy employs a dual-target profit approach and previous day's low stop-loss, aiming to balance risk and reward.
Strategy Principle
The operation of this strategy is based on the following core principles:
-
Mean Reversion Theory: Financial markets naturally tend to revert to their mean. When prices deviate far from their average level (in this strategy, the 20-period SMA), there is a higher probability of returning to that mean.
-
Bollinger Band Oversold Signal: When prices touch or break through the lower Bollinger Band (set at 2 standard deviations below the mean), the market is typically considered oversold with potential for a rebound.
-
Pinbar Pattern Confirmation: The strategy requires the previous day's high to be below the lower Bollinger Band, while the current day's closing price returns inside the band. This formation resembles a pinbar reversal pattern, strengthening the reliability of the rebound signal.
-
Dual Target Exit Strategy:
- First target: Middle band (20-period SMA)
- Second target: Upper Bollinger Band
-
Precise Stop Loss Setting: Stop loss is set at the previous trading day's lowest point, limiting potential losses.
The specific execution logic of the strategy is as follows:
entryCondition = high[1] < lowerBand[1] and close > lowerBand
This condition ensures market entry only when there is a clear pinbar reversal signal, avoiding blind entry when price merely touches the lower Bollinger Band briefly.
Strategy Advantages
Through deep analysis of this strategy, we can summarize the following significant advantages:
-
Signal Clarity: Entry conditions are clear and strict, triggering only when the previous day's high is below the lower band and the current day's close breaks above the lower band. This combination reduces the occurrence of false signals.
-
Dual Target Profit Maximization: The strategy sets two profit targets (middle and upper bands), allowing partial positions to be closed at moderate profit targets while retaining some position to pursue higher returns, achieving gradient optimization of returns.
-
Dynamic Stop Loss Mechanism: Stop loss is set at the previous day's lowest point, a design that makes the stop loss more aligned with the market's latest volatility range, more precise compared to fixed percentage stops.
-
Adaptation to Market Volatility: Since Bollinger Bands automatically adjust width according to market volatility, this strategy can self-adapt to different volatility environments, setting wider target zones in high-volatility markets and narrower zones in low-volatility markets.
-
Visualized Trading Reference: The strategy code includes complete visual aid elements, such as plotting of Bollinger Band tracks, target prices, and stop loss positions, facilitating traders' intuitive monitoring of market status and strategy execution.
Strategy Risks
Despite having a clear logical framework, this strategy still has the following potential risks:
-
Delayed Confirmation Leading to Poor Entry: The strategy uses closing prices to confirm signals, which may lead to entry prices far from ideal positions, especially during periods of violent market fluctuations, potentially affecting the risk-reward ratio.
-
False Breakout Risk: After briefly breaking through the lower Bollinger Band, prices may continue to fall rather than rise, leading to the so-called "false breakout" phenomenon. Even if entry conditions are met, losses may still occur.
-
Mean Reversion Failure: In strongly trending markets, prices may deviate from the mean for extended periods and continue to develop in a single direction, during which the mean reversion assumption may temporarily fail.
-
Stop Loss Too Close: In highly volatile markets, using the previous day's low as a stop loss may be too close to the entry price, causing normal market noise to trigger the stop loss rather than a genuine trend reversal.
-
Parameter Sensitivity: Strategy performance is highly dependent on Bollinger Band parameters (period and standard deviation multiplier), and different market environments may require different optimal parameter settings.
To address these risks, consider the following mitigation measures:
- Combine with other confirmation indicators (such as RSI or volume) to improve signal quality
- Implement partial position management strategies, avoiding full position operations
- Regularly backtest and adjust parameters to adapt to the latest market environment
- Consider pausing strategy execution in extremely volatile markets
Optimization Directions
Based on in-depth analysis of the strategy, here are several possible optimization directions:
-
Enhanced Entry Conditions:
- Add volume confirmation factors, requiring reversal signals to be accompanied by increased volume
- Consider adding oversold indicators (such as RSI<30) as auxiliary confirmation conditions
- Implementation code:
entryCondition = yesterdayHighBelowLowerBand and todayCloseAboveLowerBand and ta.rsi(close, 14) < 30
-
Dynamic Target Setting:
- Dynamically adjust target distances based on market volatility
- Set higher return targets for high-volatility markets and more conservative targets for low-volatility markets
- Can be implemented through ATR (Average True Range)
-
Stop Loss Optimization:
- Add buffer zones to stop losses to avoid triggers due to market noise
- Code implementation:
stoplossLevel = low[1] * 0.99(setting a 1% buffer) - Or use dynamic ATR stop loss:
stoplossLevel = close - (ta.atr(14) * 1.5)
-
Add Time Filters:
- Execute trades only during high-efficiency periods
- Avoid major economic data release periods
- Code example:
validTradingHour = (hour >= 9 and hour < 16)
-
Intelligent Position Management:
- Dynamically adjust position size based on volatility and signal strength
- Increase positions on stronger reversal signals, maintain standard positions on normal signals
- Code approach:
positionSize = strategy.equity * (0.01 + (0.01 * signalStrength))
The core objective of these optimization directions is to enhance the strategy's robustness and adaptability, enabling it to maintain consistent performance across different market environments.
Summary
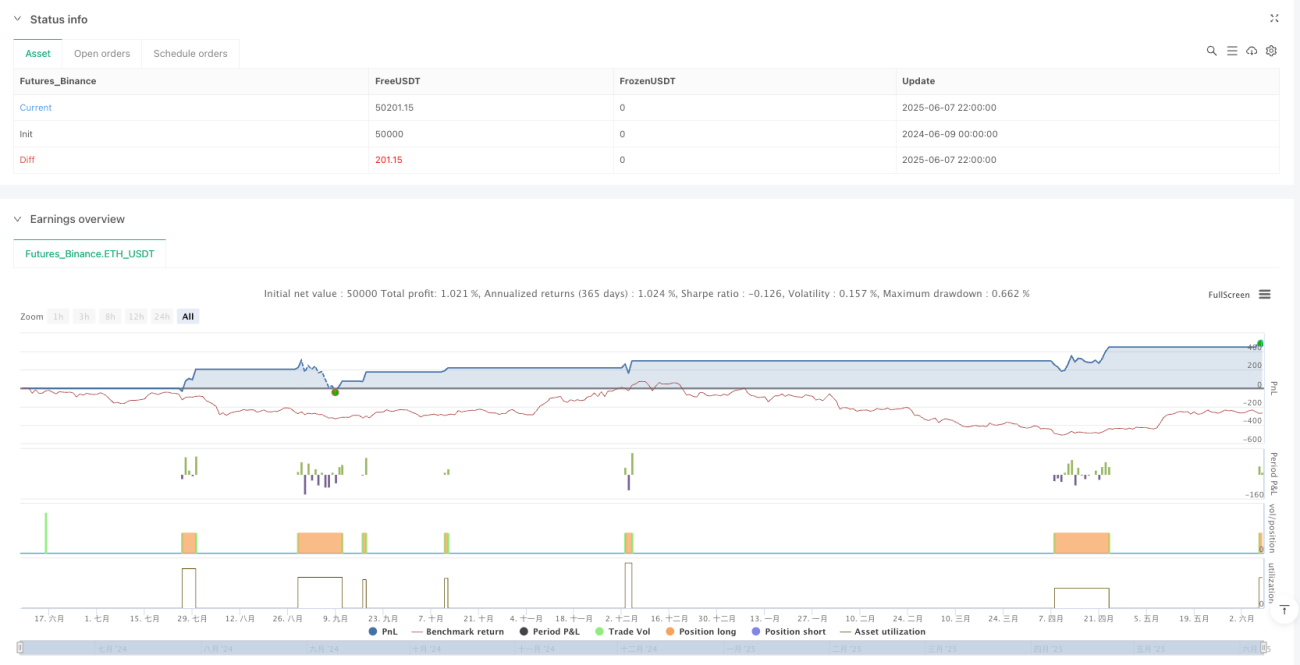
The Bollinger Band Pinbar Mean-Reversion Quantitative Strategy with Dual Target Optimization is a well-structured technical analysis trading system that cleverly combines statistical principles (Bollinger Bands) with price action patterns (pinbar formation). This strategy excels at identifying potential market reversal points through strict entry conditions and a dual-layer profit target design, effectively balancing trading frequency and profit potential.
The main advantages of the strategy lie in its clear signal definition, adaptive volatility adjustment, and carefully designed risk management framework. However, users should be aware of the limitations of the mean reversion assumption and the risks of false breakouts during implementation.
Through the suggested optimization directions, especially adding volume confirmation, dynamic stop loss settings, and volatility-based position management, this strategy has the potential to further enhance its robustness and long-term performance. Ultimately, this strategy provides traders with a reliable framework for capturing potential opportunities as markets revert from oversold conditions toward the mean.
- 1