
Overview
This strategy is a high-frequency trading system based on multiple technical indicators, integrating the Relative Strength Index (RSI), Moving Average Convergence Divergence (MACD), and Exponential Moving Average (EMA) as three core indicators, complemented by an adaptive stop-loss mechanism for risk management. The strategy primarily uses EMA price crossovers as the main signal, combined with RSI overbought/oversold zone judgments and MACD line crossovers for auxiliary confirmation, forming an efficient trading decision system. The strategy is designed to capture short-term market fluctuations, suitable for high-frequency trading operations in highly volatile market environments.
Strategy Principles
The core principle of this strategy is to improve trading frequency and accuracy through the combination of multiple indicator crossover signals:
-
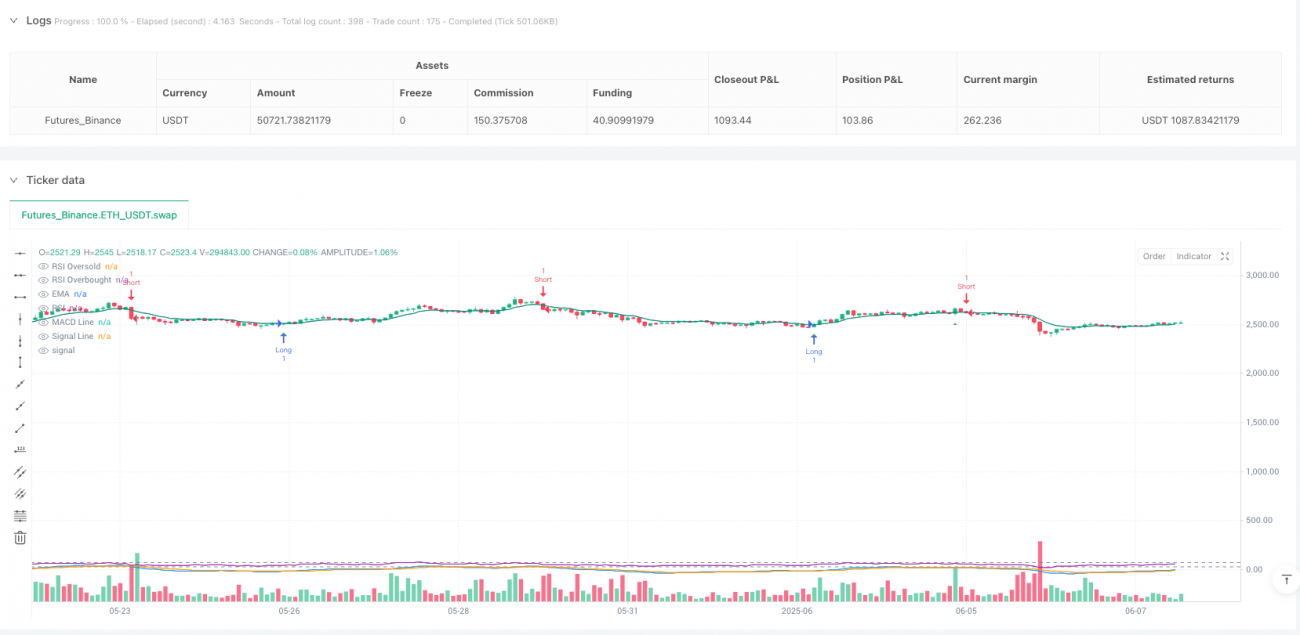
EMA Crossover as Primary Signal: The strategy employs a 9-period EMA indicator, generating a basic buy signal when price crosses above the EMA, and a basic sell signal when price crosses below the EMA.
-
MACD Signal Confirmation: Using MACD with 12-26-9 parameter settings, a bullish confirmation is recognized when the MACD line crosses above the signal line, and a bearish confirmation when the MACD line crosses below the signal line.
-
RSI Boundary Condition Assessment: Employing a 14-period RSI indicator with 30 set as the oversold level and 70 as the overbought level. The strategy incorporates RSI<35 judgment in buy conditions (relaxed criteria) and RSI>65 judgment in sell conditions (relaxed criteria).
-
Signal Combination Logic:
- Buy Signal = EMA Buy Condition AND (MACD Buy Condition OR RSI near oversold zone)
- Sell Signal = EMA Sell Condition AND (MACD Sell Condition OR RSI near overbought zone)
-
Adaptive Stop-Loss Mechanism: Calculates dynamic stop-loss levels based on a 14-period ATR indicator, with a stop-loss multiplier set at 2.0, providing risk control measures for each trade.
-
Exit Conditions: The strategy exits the current position when price crosses the EMA in the opposite direction or when price is already on the unfavorable side of the EMA.
Strategy Advantages
-
High-Frequency Trading Design: Through simplification and optimization of signal combinations, the strategy can generate more frequent trading signals, suitable for short-term traders capturing market volatility.
-
Multi-Indicator Confirmation: Combining three different types of technical indicators (trend, momentum, oscillator), enhances signal reliability and reduces interference from false signals.
-
Flexible Condition Combinations: Buy and sell signals adopt a logical structure of "Primary Condition AND (Secondary Condition 1 OR Secondary Condition 2)", increasing signal frequency while ensuring signal quality.
-
Adaptive Risk Management: Uses ATR-based dynamic stop-loss, with stop-loss levels automatically adjusting according to market volatility, making risk control more flexible and effective.
-
Symmetrical Trading Strategy: Buy and sell conditions are designed symmetrically, giving the strategy balanced performance in both long and short directions, suitable for bidirectional trading.
-
Intuitive Visualization: The strategy provides visualization of signals and indicators, facilitating traders' analysis and optimization of trading decisions.
Strategy Risks
-
Overtrading Risk: High-frequency strategies may generate excessive trading signals, leading to increased transaction costs, particularly with frequent false breakouts in sideways markets.
- Solution: Consider adding trading filters, such as minimum volatility requirements or time filters.
-
Stop-Loss Setting Risk: A fixed ATR multiplier of 2.0 may not be flexible enough in different market conditions, sometimes resulting in stops that are too tight or too loose.
- Solution: Dynamically adjust the ATR multiplier based on market volatility, or combine support/resistance levels in setting stops.
-
Parameter Sensitivity: The parameter settings of multiple technical indicators significantly impact strategy performance; inappropriate parameters may lead to poor performance.
- Solution: Conduct comprehensive parameter optimization and backtesting to find the most suitable parameter combinations for specific markets.
-
Market Condition Dependency: The strategy may perform differently across various market phases (trending, ranging, high volatility, etc.).
- Solution: Incorporate market state recognition mechanisms, adjusting strategy parameters or pausing trading under different market conditions.
-
Indicator Lag: All technical indicators have a certain lag, potentially leading to suboptimal entry or exit timing.
- Solution: Consider introducing price action analysis or faster indicators as supplements to reduce lag effects.
Strategy Optimization Directions
-
Dynamic Parameter Adjustment:
- Automatically adjust RSI overbought/oversold thresholds and MACD parameters based on market volatility, enabling the strategy to better adapt to different market environments.
- Principle: Relax thresholds in high-volatility markets and tighten thresholds in low-volatility markets to balance signal quality and frequency.
-
Market State Recognition:
- Add a market state recognition module, such as using the ADX indicator to judge trend strength, favoring trend-following trades in strong trending markets and reversal signals in ranging markets.
- Principle: Different market states suit different trading strategies; adaptive adjustments can improve overall performance.
-
Timeframe Coordination:
- Introduce multi-timeframe analysis, using higher timeframes to determine the main trend direction and only taking positions in the trend direction.
- Principle: Follow the trading principle of "with the major trend, against the minor trend" to improve win rates.
-
Take-Profit Mechanism Design:
- The current strategy only has stop-loss and EMA-based exit mechanisms; consider adding ATR-based dynamic take-profit or volatility-based partial profit-taking mechanisms.
- Principle: A good take-profit mechanism can lock in profits and improve the strategy's risk-reward ratio.
-
Volume Filtering:
- Add volume confirmation conditions, validating signals only when trading volume increases, filtering out low-volume false breakouts.
- Principle: Price movements should be accompanied by volume changes, which helps verify signal reliability.
-
Machine Learning Optimization:
- Consider introducing machine learning algorithms to dynamically optimize strategy parameters or generate weights for trading signals.
- Principle: Machine learning can discover patterns difficult to identify in traditional technical analysis, improving strategy adaptability.
Summary
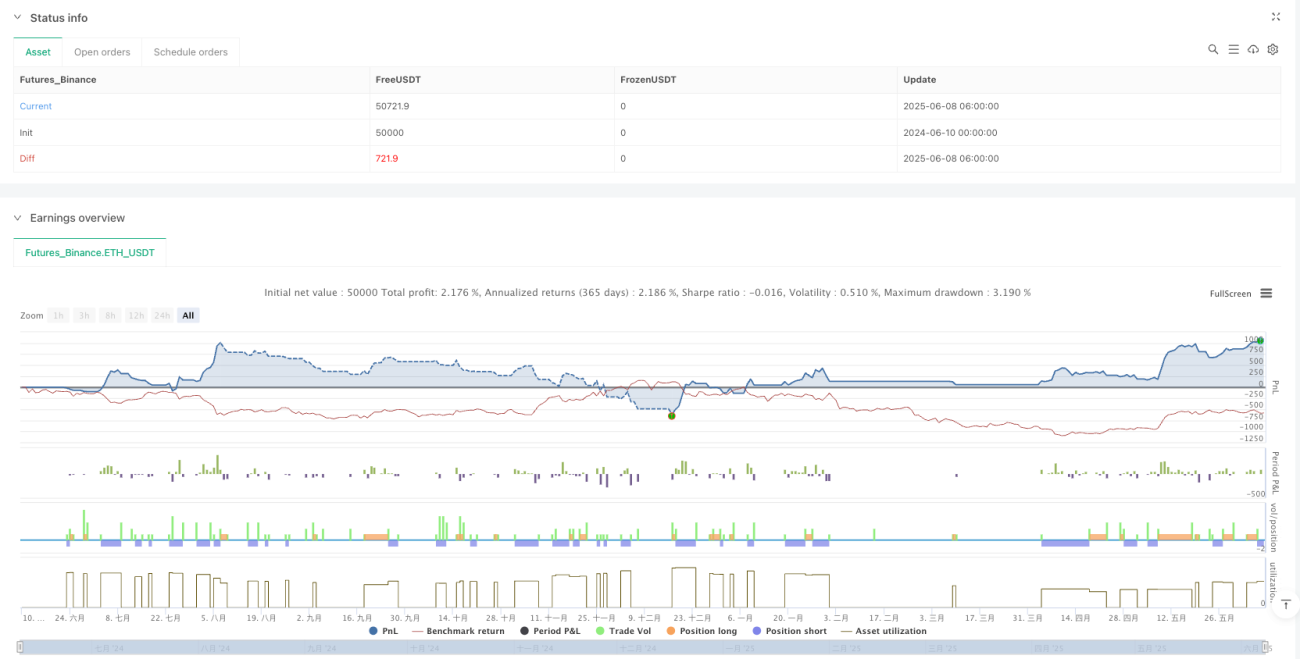
The High-Frequency RSI-MACD-EMA Composite Technical Analysis Strategy is a trading system that comprehensively utilizes multiple technical indicators, using EMA crossovers as the leading signal, combined with MACD and RSI for confirmation, forming a high-frequency trading decision mechanism. The main advantages of the strategy lie in its ability to frequently capture short-term market fluctuations, improve signal reliability through multi-indicator confirmation, and manage risk through ATR-based dynamic stop-losses.
However, the strategy also faces challenges such as overtrading, parameter sensitivity, and market condition dependency. Future optimization directions include dynamic parameter adjustment, market state recognition, multi-timeframe analysis, improvement of take-profit mechanisms, volume filtering, and machine learning applications. Through these optimizations, the strategy's stability, adaptability, and profitability can be further enhanced.
Overall, this is a well-designed, logically clear high-frequency trading strategy framework with good practicality and scalability. For traders pursuing short-term market opportunities, this strategy provides a reliable decision-making basis, but users need to make appropriate parameter adjustments and optimizations according to their risk tolerance and trading objectives.
- 1