
Overview
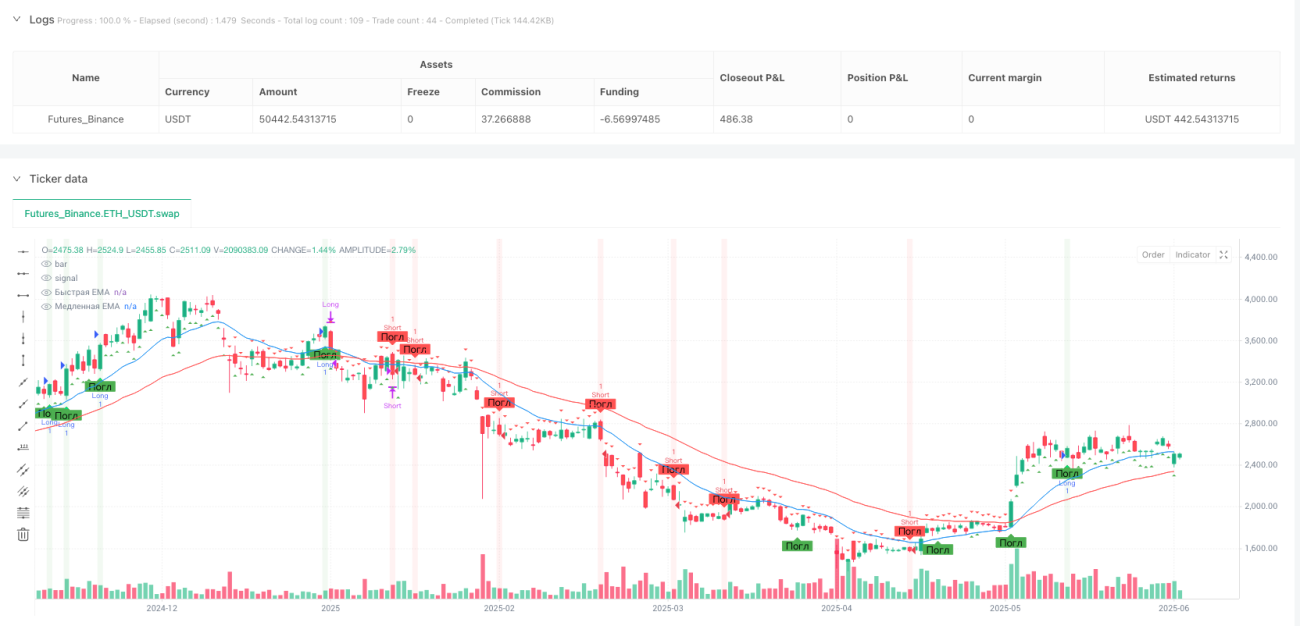
This strategy is an advanced trend following system that combines candlestick pattern recognition with Exponential Moving Average (EMA) trend filtering. It identifies specific candlestick formations (Hammer and Engulfing patterns) as entry signals, while using a Fast EMA (20-period) and Slow EMA (50-period) crossover system to confirm market trend direction, thus increasing trade success rate. The strategy also incorporates intelligent risk management mechanisms, including a 5% fixed stop-loss and 1% trailing stop, as well as an innovative exit delay mechanism that waits for 2 complete candlesticks before executing exit signals, effectively reducing false breakout exits in oscillating markets.
Strategy Principles
The core principles of this strategy are based on the combination of trend following and price pattern recognition. The specific implementation logic is as follows:
-
Trend Identification:
- Uptrend: Fast EMA (20-period) > Slow EMA (50-period)
- Downtrend: Fast EMA (20-period) < Slow EMA (50-period)
-
Entry Conditions:
- Long Entry: (Hammer OR Bullish Engulfing) AND Uptrend AND No existing position
- Short Entry: Bearish Engulfing AND Downtrend AND No existing position
-
Candlestick Pattern Recognition:
- Hammer: Detected through strict body/wick ratios ((low - open) >= 2 * (open - close))
- Engulfing: Multi-condition confirmation ensuring current candle completely "engulfs" the previous one
-
Exit Mechanism:
- Primary Exit: EMA crossover (Fast EMA crosses Slow EMA)
- Delayed Execution: Waits for 2 complete candlesticks after signal
- Emergency Exits: 5% fixed stop-loss + 1% trailing stop
The code implements a counter system to manage the exit delay, ensuring that exits are only executed after waiting for the specified number of candlesticks after the signal is triggered, effectively reducing premature exits in oscillating markets.
Strategy Advantages
After in-depth code analysis, this strategy has the following significant advantages:
-
Multiple Confirmation Mechanism: Combining candlestick patterns with EMA trend filtering significantly improves the reliability of trading signals and reduces false signals.
-
Advanced Pattern Recognition: The strategy employs strict parameter definitions for Hammer and Engulfing patterns, ensuring that only high-quality patterns are recognized and generate trading signals.
-
Intelligent Exit System: The innovative exit delay mechanism (controlled by the exitDelayBars parameter) allows the strategy to avoid prematurely exiting favorable trades due to short-term market fluctuations, greatly improving the system's noise resistance.
-
Comprehensive Risk Management: Integrates dual protection mechanisms of fixed stop-loss (5%) and trailing stop (1%), effectively controlling single trade risk while securing profits.
-
Visual Assistance: The strategy provides rich visualization elements, including colored EMA lines, candlestick pattern annotations, and background highlighting, helping traders intuitively understand market conditions and signal generation processes.
-
No Pyramiding: The strategy sets pyramiding=0, ensuring only one position at a time, avoiding excessive leverage and risk concentration issues.
Strategy Risks
Despite its sophisticated design, the strategy still has the following potential risks:
-
Poor Performance in Oscillating Markets: In range-bound markets without clear trends, EMA crossovers and candlestick patterns may appear frequently, leading to excessive false signals and losing trades. The solution is to avoid using it in oscillating markets or add additional filtering conditions such as RSI indicators to identify range-bound areas.
-
Fixed Stop-Loss Risk: The 5% fixed stop-loss may be too tight in some highly volatile markets, causing premature stops, while being too loose in low volatility markets. It is recommended to dynamically adjust the stop-loss percentage based on the volatility characteristics of the specific trading instrument.
-
Dual Nature of Delayed Exit: While delayed exits can reduce losses from false breakouts, they may also cause missed optimal exit points during genuine trend reversals, increasing drawdowns. Consider combining volatility indicators to dynamically adjust the delay period.
-
Over-reliance on EMAs: The strategy primarily relies on EMA crossovers to determine trends, but EMAs may lag in rapidly changing markets. Consider incorporating more sensitive price momentum indicators in highly volatile markets.
-
Lack of Volume Confirmation: The current strategy doesn't utilize volume data to confirm candlestick patterns, which may reduce signal reliability. Consider adding volume confirmation conditions to improve the proportion of effective signals.
Strategy Optimization Directions
Based on code analysis, the strategy can be optimized in the following directions:
-
Adaptive Parameter System: Replace the fixed EMA periods (20 and 50) with adaptive periods that automatically adjust based on market volatility, using shorter periods in low-volatility markets to increase sensitivity and longer periods in high-volatility markets to reduce noise. This allows the strategy to better adapt to different market environments.
-
Integrate ATR Dynamic Stop-Loss: Replace fixed percentage stop-losses with dynamic stops based on Average True Range (ATR), making stop-loss points more reasonably reflect actual market volatility, avoiding stops that are too close in high volatility or too far in low volatility.
-
Add Volume Confirmation: Add volume conditions to verify candlestick patterns, such as requiring volume to be higher than average when forming Hammer or Engulfing patterns, to improve pattern reliability.
-
Multi-Timeframe Analysis: Introduce multi-timeframe confirmation mechanisms, requiring the trend direction of higher timeframes to be consistent with the trading timeframe, reducing the risk of trading against the major trend.
-
Time Filter: Add trading time filters to avoid low liquidity or high volatility periods (such as economic data releases), reducing slippage and risks from abnormal fluctuations.
-
Machine Learning Optimization: Consider introducing machine learning algorithms to optimize parameter selection and signal filtering, training models through historical data to identify the most favorable trading environments and parameter settings.
Summary
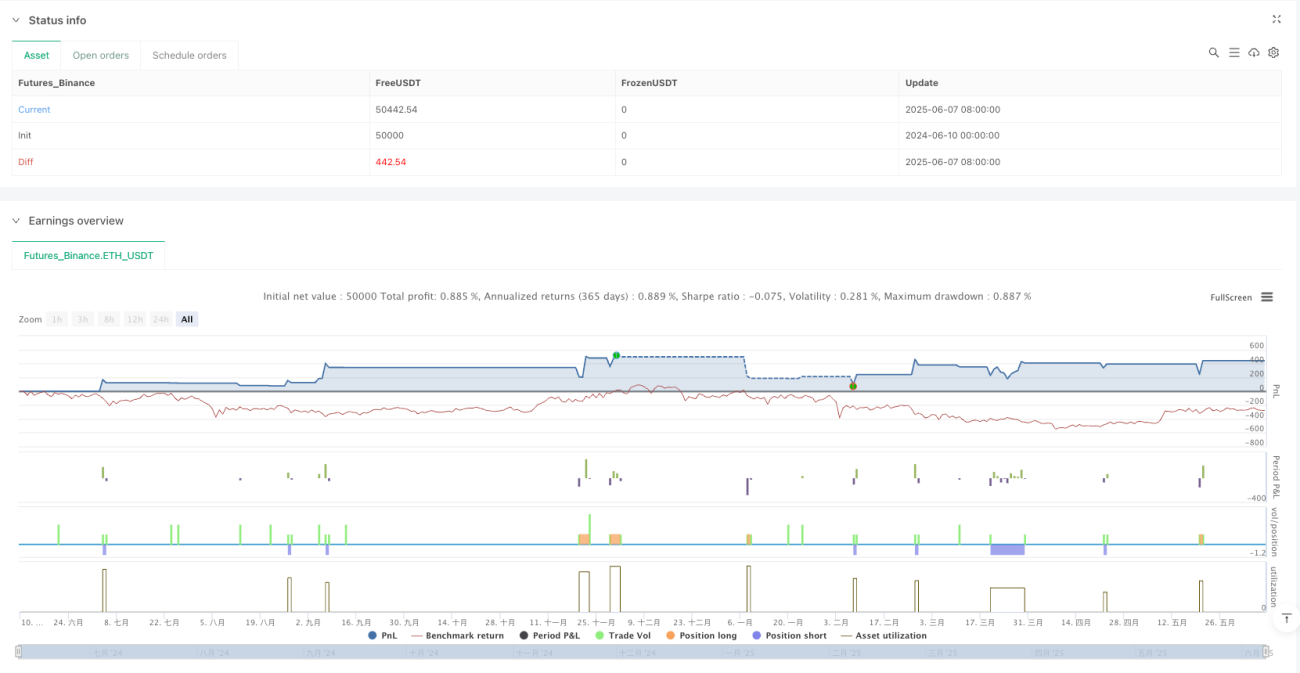
This is a well-designed advanced trend following system that creates a powerful trading strategy with multiple confirmation mechanisms by combining candlestick pattern recognition with EMA trend filtering. The core advantages of the strategy lie in its intelligent entry conditions and innovative delayed exit mechanism, effectively improving signal quality and reducing losses from false breakouts.
The strategy is particularly suitable for markets with obvious medium to long-term trends, with 1-hour to 4-hour timeframes likely being the optimal application scenarios. To further improve strategy performance, it is recommended to introduce adaptive parameter systems, ATR-based dynamic stop-losses, and multi-timeframe analysis optimization measures. At the same time, care should be taken to avoid using this strategy in oscillating markets, or additional filters should be added to identify non-trending environments.
Through careful risk management settings and visual assistance, this strategy not only provides a reliable execution framework for quantitative trading but also offers valuable market analysis tools for manual traders. Future optimization directions mainly focus on adaptability and multi-dimensional confirmation to further improve the stability of the strategy's performance in different market environments.
- 1