Zero-Lag MACD Ichimoku Momentum Integration Trading System

MACD EMA SMA ATR ICHIMOKU EOM RRR 动量指标 零滞后指标 均线交叉
Created on: 2025-06-11 09:58:31 Modified on: 2025-06-11 09:58:31
Copy: 3 Number of hits: 383
avatar of ianzeng123 ianzeng123
2
Follow
319
Followers

 Zero-Lag MACD Ichimoku Momentum Integration Trading System  Zero-Lag MACD Ichimoku Momentum Integration Trading System

Overview

The Zero-Lag MACD Ichimoku Momentum Integration Trading System is a quantitative trading strategy designed for fast-paced market environments, ingeniously integrating three technical indicators with distinct characteristics: Zero Lag MACD, Ichimoku Cloud’s Kijun-sen line, and the Ease of Movement (EOM) indicator. These three indicators work synergistically to provide multi-layered verification when confirming trading signals, significantly improving signal quality and reliability. This strategy is particularly suitable for volatile markets such as cryptocurrencies and performs excellently in lower timeframes (e.g., 5-minute charts).

The core design philosophy of this strategy is to trigger trading signals only when multiple conditions are simultaneously satisfied, thereby filtering out low-quality trading opportunities, reducing false signals, and implementing robust risk management through dynamic stop-losses and fixed risk-reward ratios. Through parameter optimization and condition screening, this strategy can adapt to different market environments, providing traders with high-probability trading opportunities.

Strategy Principles

The Zero-Lag MACD Ichimoku Momentum Integration Trading System operates based on the coordinated action of three core indicators:

  1. Zero Lag MACD (Enhanced Version 1.2): Compared to traditional MACD, Zero Lag MACD reduces signal lag through special calculation methods, increasing sensitivity to trend turning points. This indicator is used in the strategy to capture precise momentum changes, with its calculation process including:

    • Zero lag calculation for fast and slow lines: zerolagEMA = (2 * ma1) - ma2 and zerolagslowMA = (2 * mas1) - mas2
    • MACD line: The difference between the fast and slow lines
    • Signal line: Smoothed moving average of MACD
    • Histogram: The difference between MACD line and signal line
  2. Ichimoku Cloud’s Kijun-sen Line: Acting as a dynamic support/resistance and trend filter, the Kijun-sen line confirms the prevailing market direction. Its calculation is based on the Donchian channel principle, taking the average of the highest and lowest prices within a specific period:

    • baseLine = math.avg(ta.lowest(basePeriods), ta.highest(basePeriods))
  3. Ease of Movement (EOM): This volume-based oscillator confirms price movements by measuring the ease with which price changes. EOM is calculated using the formula:

    • eom = ta.sma(div * ta.change(hl2) * (high - low) / volume, eom_length)

The strategy’s entry conditions combine signals from these three indicators:

Long Entry Conditions: - MACD line crosses above the signal line (ta.crossover(ZeroLagMACD, signal)) - MACD line is below the histogram (ZeroLagMACD < hist) - Price is above Kijun-sen (close > baseLine) - EOM is greater than zero (eom > 0)

Short Entry Conditions: - MACD line crosses below the signal line (ta.crossunder(ZeroLagMACD, signal)) - MACD line is above the histogram (ZeroLagMACD > hist) - Price is below Kijun-sen (close < baseLine) - EOM is less than zero (eom < 0)

For risk management, the strategy employs a dynamic ATR-based stop-loss, with the stop-loss distance set at 2.5 times the current ATR, and a fixed risk-reward ratio of 1:1.2, ensuring a reasonable profit target for each trade.

Strategy Advantages

  1. Multiple Confirmation System: By integrating three indicators with different characteristics (trend, momentum, and volume), the strategy effectively filters out false signals and only enters when high-probability trading opportunities appear, significantly increasing the success rate of trades.

  2. Reduced Lag: Using Zero Lag MACD instead of traditional MACD allows for earlier capture of market turning points, reducing the lag issues common in traditional indicators and enabling traders to enter closer to ideal entry points.

  3. Strong Adaptability: All parameters in the strategy can be customized according to different market environments, trading instruments, and timeframes, giving it extreme adaptability. Core indicators including MACD period parameters, Kijun-sen period, and EOM length can all be specifically optimized.

  4. Comprehensive Risk Management Mechanism:

    • Dynamic stop-loss design (ATR-based volatility adaptation) ensures stop-loss positions automatically adjust according to market volatility
    • Fixed risk-reward ratio (1:1.2) provides consistent profit expectations
    • The strategy only opens positions when multiple conditions are simultaneously met, significantly reducing the risk of false signals
  5. Multi-dimensional Market Analysis: The strategy simultaneously considers price momentum (MACD), price structure (Kijun-sen), and volume confirmation (EOM), analyzing the market from multiple dimensions to form a more comprehensive trading decision system.

  6. Visualization Features: The strategy provides rich visualization options, including signal markers, indicator line displays, and information panels, helping traders intuitively understand and monitor trading signals and current market status.

Strategy Risks

  1. False Signal Risk: Despite using multiple indicators for confirmation, false signals may still occur in highly volatile or sideways markets. Especially when the market frequently changes direction in a short period, multiple indicator confirmation may result in too few trading signals, missing some trading opportunities.

    • Solution: Parameters can be adjusted according to market conditions; in high volatility periods, certain conditions may need to be relaxed or the sensitivity of MACD and EOM adjusted.
  2. Parameter Optimization Challenges: The strategy has multiple parameters that need adjustment (MACD parameters, Kijun-sen period, EOM length, etc.). Improper parameter settings may lead to overfitting historical data and poor performance in future market environments.

    • Solution: Employ forward testing and robustness testing to ensure parameters remain effective across different market environments; avoid over-optimization by seeking parameter combinations that perform stably under various market conditions.
  3. Slippage and Liquidity Risk: In lower timeframe trading, especially for volatile markets like cryptocurrencies, slippage and liquidity issues may arise, causing actual execution prices to differ from strategy-calculated prices.

    • Solution: Include slippage simulation in backtesting; consider adding liquidity filtering conditions to the strategy; prioritize markets with better liquidity for trading.
  4. Stop-Loss Breach Risk: In rapidly fluctuating markets, ATR-based stop-losses may not handle extreme price movements, resulting in actual losses exceeding expectations.

    • Solution: Consider adding additional stop-loss protection mechanisms, such as automatically adjusting the ATR multiplier under extreme volatility conditions or setting absolute maximum loss limits.
  5. Technical Dependency: The strategy heavily relies on technical indicators and may perform poorly in situations where market volatility is caused by fundamental changes.

    • Solution: Reduce trading size or pause trading before important economic data or event releases; consider integrating fundamental filters.

Strategy Optimization Directions

  1. Indicator Parameter Adaptation: The current strategy uses fixed indicator parameters. Consider implementing a mechanism for adaptive parameter adjustment based on market volatility or trading cycles to automatically optimize MACD, Kijun-sen, and EOM parameters. This would allow the strategy to better adapt to different market phases and improve overall stability.

    • Parameters could be dynamically adjusted based on volatility or trend strength of recent N periods
    • Research optimal parameter combinations for different market states (trending, oscillating) and build a switching mechanism
  2. Add Market State Classification: By adding a market state recognition module, the strategy can adjust trading conditions and risk management parameters based on whether the current market is in a trending or oscillating state. For example:

    • Increase filtering conditions or reduce trading frequency in oscillating markets
    • Relax certain entry conditions in clear trends while extending holding periods
    • Consider adding trend strength indicators like ADX to help identify market states
  3. Optimize Take-Profit Strategy: The current strategy uses a fixed risk-reward ratio (1:1.2) to set take-profit levels. Consider implementing more flexible take-profit mechanisms, such as:

    • Partial take-profit strategy: Move stop-loss to break-even after reaching certain profit levels, allowing the remaining position to continue running
    • Dynamic take-profit based on technical levels (such as support/resistance, Fibonacci levels)
    • Use ATR volatility to set dynamic profit targets that automatically adjust in different volatility environments
  4. Integrate Machine Learning Models: Consider using machine learning techniques to enhance the strategy’s predictive capability:

    • Use machine learning algorithms to analyze historical patterns and predict signal success probability
    • Build a quality classification system for trading signals based on historical performance
    • Utilize deep learning models to identify more complex market patterns
  5. Add Time Filters: Market behavior characteristics may vary across different time periods. Adding time filters can avoid trading during inefficient trading sessions:

    • Analyze trading success rates across different time periods based on historical data
    • Pause trading during periods of too low or too high volatility
    • Consider the trading session characteristics of different markets, such as optimizing for the 24-hour trading nature of cryptocurrency markets

Summary

The Zero-Lag MACD Ichimoku Momentum Integration Trading System is a well-designed quantitative trading strategy that forms a multi-dimensional trading signal confirmation system by integrating Zero Lag MACD, Kijun-sen, and EOM technical indicators. The strategy adopts a strict multiple confirmation mechanism for identifying entry points and combines dynamic stop-loss with fixed risk-reward ratio for comprehensive control throughout the trading process.

The core advantages of the strategy lie in its reduced lag design philosophy and the mechanism of multiple indicators working collaboratively, enabling it to capture high-probability trading opportunities in rapidly changing markets. Meanwhile, the fully customizable parameter settings allow traders to make flexible adjustments according to different market environments and personal risk preferences.

Although the strategy has some potential risks, such as parameter optimization challenges and false signal risks, these can be further mitigated through the suggested optimization directions—like indicator parameter adaptation, market state classification, and machine learning integration—to enhance the strategy’s robustness and adaptability.

Overall, this is an advanced and structurally complete quantitative trading system suitable for traders with a certain foundation in technical analysis, especially investors who pursue high-quality trading signals rather than high-frequency trading. With reasonable parameter adjustments and continuous optimization, this strategy has the potential to provide stable trading performance across various market environments.
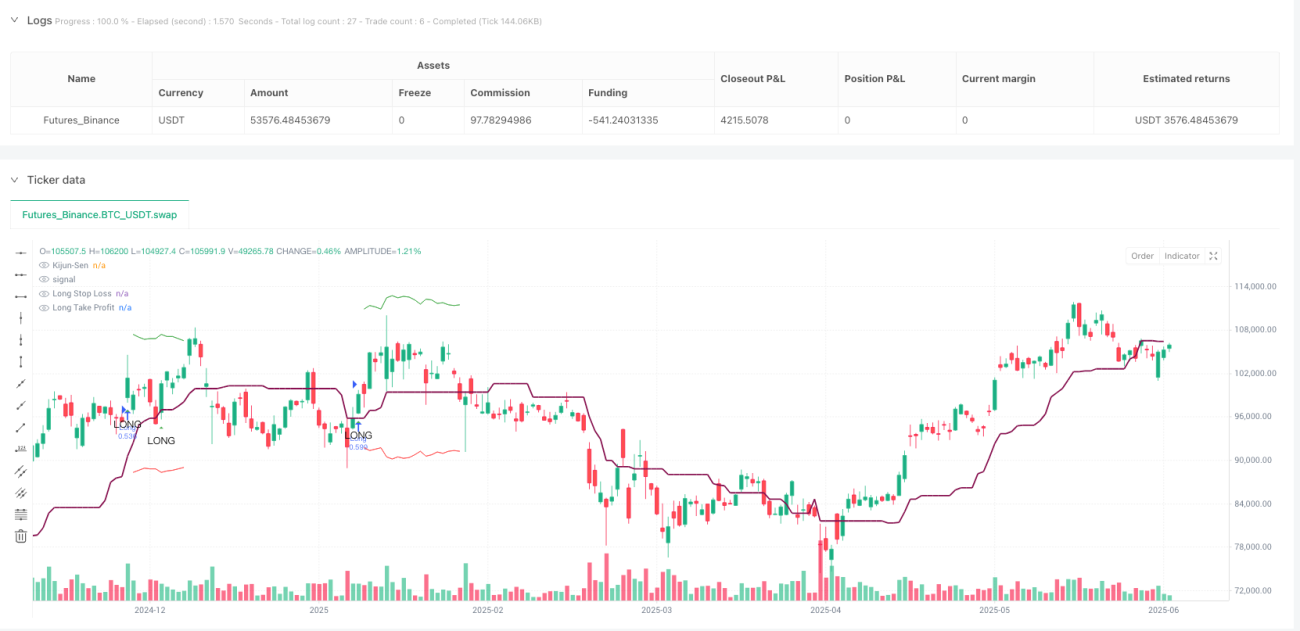
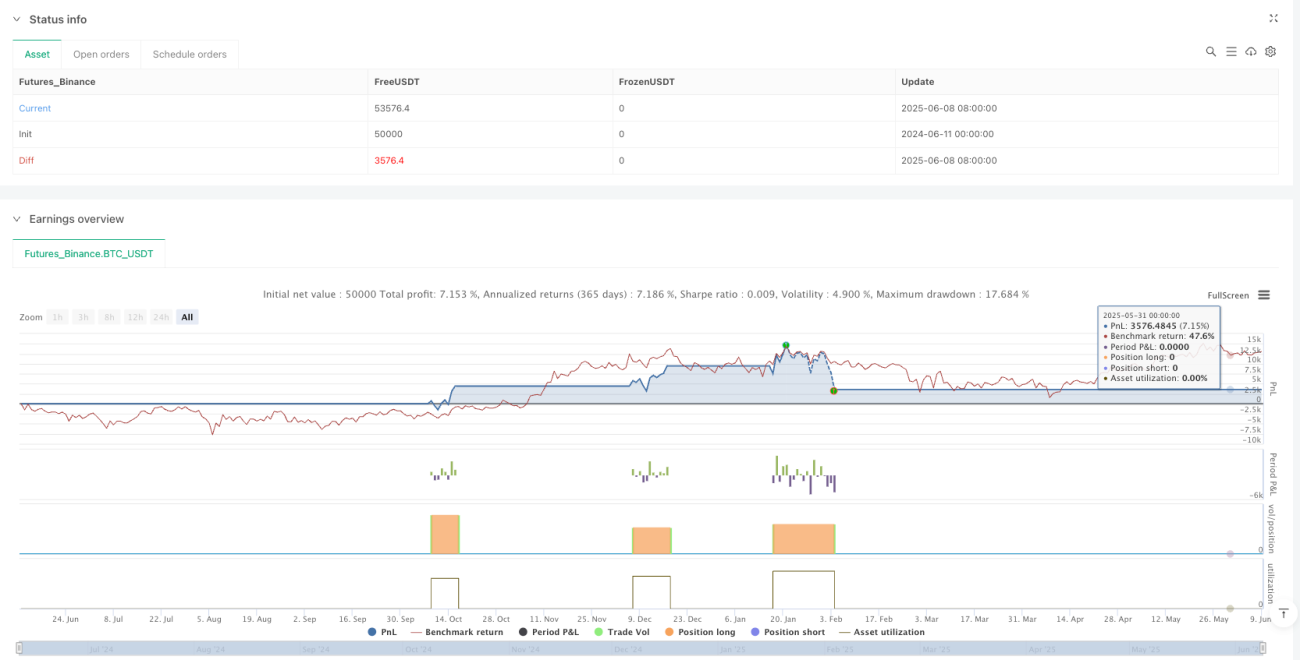
Strategy source code
/*backtest
start: 2024-06-11 00:00:00
end: 2025-06-09 08:00:00
period: 1d
basePeriod: 1d
exchanges: [{"eid":"Futures_Binance","currency":"BTC_USDT"}]
*/

//@version=6
strategy(title="Zero Lag MACD + Kijun-sen + EOM Strategy", shorttitle="ZL-KJ-EOM", overlay=true, default_qty_type=strategy.percent_of_equity, default_qty_value=100)

// ================================================================================
// INPUT PARAMETERS - ALL INDICATOR SETTINGS
// ================================================================================

// === ZERO LAG MACD SETTINGS ===
group_macd = "Zero Lag MACD Enhanced Settings"
fastLength = input.int(12, title="Fast MM period", minval=1, group=group_macd)
slowLength = input.int(26, title="Slow MM period", minval=1, group=group_macd)
signalLength = input.int(9, title="Signal MM period", minval=1, group=group_macd)
MacdEmaLength = input.int(9, title="MACD EMA period", minval=1, group=group_macd)
useEma = input.bool(true, title="Use EMA (otherwise SMA)", group=group_macd)
useOldAlgo = input.bool(false, title="Use Glaz algo (otherwise 'real' original zero lag)", group=group_macd)
showDots = input.bool(true, title="Show symbols to indicate crossing", group=group_macd)
dotsDistance = input.float(1.5, title="Symbols distance factor", minval=0.1, group=group_macd)

// === KIJUN-SEN SETTINGS ===
group_kijun = "Kijun-Sen Settings"
basePeriods = input.int(26, minval=1, title="Kijun-Sen Period", group=group_kijun)

// === EASE OF MOVEMENT SETTINGS ===
group_eom = "Ease of Movement Settings"
eom_length = input.int(14, minval=1, title="EOM Length", group=group_eom)
div = input.int(10000, title="EOM Divisor", minval=1, group=group_eom)

// === RISK MANAGEMENT SETTINGS ===
group_risk = "Risk Management Settings"
atr_period = input.int(14, title="ATR Period", minval=1, group=group_risk)
atr_multiplier = input.float(2.5, title="ATR Multiplier for Stop Loss", minval=0.1, step=0.1, group=group_risk)
risk_reward_ratio = input.float(1.2, title="Risk-to-Reward Ratio", minval=0.1, step=0.1, group=group_risk)

// === DISPLAY SETTINGS ===
group_display = "Display Settings"
show_macd_plot = input.bool(false, title="Show MACD Plot (Separate Pane)", group=group_display)
show_eom_plot = input.bool(false, title="Show EOM Plot (Separate Pane)", group=group_display)
show_kijun_plot = input.bool(true, title="Show Kijun-Sen Line", group=group_display)
show_signals = input.bool(true, title="Show Entry Signals", group=group_display)
show_info_table = input.bool(true, title="Show Info Table", group=group_display)

// ================================================================================
// ZERO LAG MACD ENHANCED VERSION 1.2 (WITH USER INPUTS)
// ================================================================================

source = close

// Fast line
ma1 = useEma ? ta.ema(source, fastLength) : ta.sma(source, fastLength) 
ma2 = useEma ? ta.ema(ma1, fastLength) : ta.sma(ma1, fastLength) 
zerolagEMA = ((2 * ma1) - ma2)

// Slow line
mas1 = useEma ? ta.ema(source, slowLength) : ta.sma(source, slowLength)
mas2 = useEma ? ta.ema(mas1, slowLength) : ta.sma(mas1, slowLength)
zerolagslowMA = ((2 * mas1) - mas2)

// MACD line
ZeroLagMACD = zerolagEMA - zerolagslowMA 

// Signal line
emasig1 = ta.ema(ZeroLagMACD, signalLength)
emasig2 = ta.ema(emasig1, signalLength)
signal = useOldAlgo ? ta.sma(ZeroLagMACD, signalLength) : (2 * emasig1) - emasig2

// MACD Histogram
hist = ZeroLagMACD - signal

// MACD EMA line
macd_ema = ta.ema(ZeroLagMACD, MacdEmaLength)

// MACD plot components (for separate pane if enabled)
upHist = (hist > 0) ? hist : 0
downHist = (hist <= 0) ? hist : 0

// ================================================================================
// KIJUN-SEN INDICATOR (WITH USER INPUTS)
// ================================================================================

donchian(len) => math.avg(ta.lowest(len), ta.highest(len))
baseLine = donchian(basePeriods)

// ================================================================================
// EASE OF MOVEMENT INDICATOR (WITH USER INPUTS)
// ================================================================================

var cumVol = 0.
cumVol += nz(volume)
if barstate.islast and cumVol == 0
    runtime.error("No volume is provided by the data vendor.")

eom = ta.sma(div * ta.change(hl2) * (high - low) / volume, eom_length)

// ================================================================================
// ATR CALCULATION FOR STOP LOSS
// ================================================================================

atr = ta.atr(atr_period)

// ================================================================================
// ENTRY CONDITIONS
// ================================================================================

// Long Entry Conditions
macd_cross_up = ta.crossover(ZeroLagMACD, signal)
macd_below_hist = ZeroLagMACD < hist  // MACD line below histogram
price_above_kijun = close > baseLine  // Price above Kijun-sen
eom_above_zero = eom > 0  // EOM above zero

long_condition = macd_cross_up and macd_below_hist and price_above_kijun and eom_above_zero

// Short Entry Conditions
macd_cross_down = ta.crossunder(ZeroLagMACD, signal)
macd_above_hist = ZeroLagMACD > hist  // MACD line above histogram
price_below_kijun = close < baseLine  // Price below Kijun-sen
eom_below_zero = eom < 0  // EOM below zero

short_condition = macd_cross_down and macd_above_hist and price_below_kijun and eom_below_zero

// ================================================================================
// STRATEGY EXECUTION
// ================================================================================

// Entry Logic - Enter at next candle open as specified
if long_condition
    strategy.entry("Long", strategy.long, comment="Long Entry")

if short_condition
    strategy.entry("Short", strategy.short, comment="Short Entry")

// Exit Logic (Stop Loss and Take Profit)
if strategy.position_size > 0  // Long position
    stop_loss = strategy.position_avg_price - (atr * atr_multiplier)
    distance_to_sl = strategy.position_avg_price - stop_loss
    take_profit = strategy.position_avg_price + (distance_to_sl * risk_reward_ratio)
    strategy.exit("Long Exit", "Long", stop=stop_loss, limit=take_profit, comment="Long Exit")

if strategy.position_size < 0  // Short position
    stop_loss = strategy.position_avg_price + (atr * atr_multiplier)
    distance_to_sl = stop_loss - strategy.position_avg_price
    take_profit = strategy.position_avg_price - (distance_to_sl * risk_reward_ratio)
    strategy.exit("Short Exit", "Short", stop=stop_loss, limit=take_profit, comment="Short Exit")

// ================================================================================
// PLOTTING INDICATORS
// ================================================================================

// Plot Kijun-sen
plot(show_kijun_plot ? baseLine : na, color=color.new(color.maroon, 0), title="Kijun-Sen", linewidth=2)

// Plot entry signals
plotshape(show_signals and long_condition, title="Long Signal", location=location.belowbar, color=color.new(color.green, 0), style=shape.triangleup, size=size.small, text="LONG")
plotshape(show_signals and short_condition, title="Short Signal", location=location.abovebar, color=color.new(color.red, 0), style=shape.triangledown, size=size.small, text="SHORT")

// Plot stop loss and take profit levels for current position
plot(strategy.position_size > 0 ? strategy.position_avg_price - (atr * atr_multiplier) : na, color=color.new(color.red, 0), style=plot.style_linebr, linewidth=1, title="Long Stop Loss")
plot(strategy.position_size > 0 ? strategy.position_avg_price + ((strategy.position_avg_price - (strategy.position_avg_price - (atr * atr_multiplier))) * risk_reward_ratio) : na, color=color.new(color.green, 0), style=plot.style_linebr, linewidth=1, title="Long Take Profit")

plot(strategy.position_size < 0 ? strategy.position_avg_price + (atr * atr_multiplier) : na, color=color.new(color.red, 0), style=plot.style_linebr, linewidth=1, title="Short Stop Loss")
plot(strategy.position_size < 0 ? strategy.position_avg_price - (((strategy.position_avg_price + (atr * atr_multiplier)) - strategy.position_avg_price) * risk_reward_ratio) : na, color=color.new(color.green, 0), style=plot.style_linebr, linewidth=1, title="Short Take Profit")

// ================================================================================
// SEPARATE PANE PLOTS (OPTIONAL)
// ================================================================================

// MACD Plot (separate pane)
plot(show_macd_plot ? upHist : na, color=color.new(color.green, 40), style=plot.style_columns, title='MACD Positive Histogram')
plot(show_macd_plot ? downHist : na, color=color.new(color.purple, 40), style=plot.style_columns, title='MACD Negative Histogram')
plot(show_macd_plot ? ZeroLagMACD : na, color=color.new(color.black, 0), linewidth=2, title='MACD Line')
plot(show_macd_plot ? signal : na, color=color.new(color.gray, 0), linewidth=2, title='Signal Line')
plot(show_macd_plot ? macd_ema : na, color=color.new(color.red, 0), linewidth=2, title='EMA on MACD Line')

// MACD zero line
plot(show_macd_plot ? 0 : na, "MACD Zero Line", color=color.new(color.gray, 50))

// MACD crossover dots - calculate cross condition globally for consistency
macd_signal_cross = ta.cross(ZeroLagMACD, signal)
circleYPosition = signal * dotsDistance
plot(show_macd_plot and showDots and macd_signal_cross ? circleYPosition : na, style=plot.style_circles, linewidth=4, color=hist > 0 ? color.new(color.green, 0) : color.new(color.purple, 0), title='MACD Cross Dots')

// EOM Plot (separate pane)
plot(show_eom_plot ? eom : na, "EOM", color=color.new(#43A047, 0), linewidth=2)
plot(show_eom_plot ? 0 : na, "EOM Zero Line", color=color.new(color.gray, 50))

// ================================================================================
// INFO TABLE
// ================================================================================

var table info_table = table.new(position.top_right, 2, 8, bgcolor=color.new(color.white, 0), border_width=1)
if show_info_table and barstate.islast
    table.cell(info_table, 0, 0, "Position", text_color=color.black, bgcolor=color.new(color.gray, 70))
    table.cell(info_table, 1, 0, strategy.position_size > 0 ? "LONG" : strategy.position_size < 0 ? "SHORT" : "FLAT", 
               text_color=strategy.position_size > 0 ? color.green : strategy.position_size < 0 ? color.red : color.black)
    
    table.cell(info_table, 0, 1, "Entry Price", text_color=color.black, bgcolor=color.new(color.gray, 70))
    table.cell(info_table, 1, 1, strategy.position_size != 0 ? str.tostring(strategy.position_avg_price, "#.####") : "N/A", text_color=color.black)
    
    table.cell(info_table, 0, 2, "Current ATR", text_color=color.black, bgcolor=color.new(color.gray, 70))
    table.cell(info_table, 1, 2, str.tostring(atr, "#.####"), text_color=color.black)
    
    table.cell(info_table, 0, 3, "MACD Value", text_color=color.black, bgcolor=color.new(color.gray, 70))
    table.cell(info_table, 1, 3, str.tostring(ZeroLagMACD, "#.####"), text_color=color.black)
    
    table.cell(info_table, 0, 4, "Signal Value", text_color=color.black, bgcolor=color.new(color.gray, 70))
    table.cell(info_table, 1, 4, str.tostring(signal, "#.####"), text_color=color.black)
    
    table.cell(info_table, 0, 5, "EOM Value", text_color=color.black, bgcolor=color.new(color.gray, 70))
    table.cell(info_table, 1, 5, str.tostring(eom, "#.##"), text_color=eom > 0 ? color.green : color.red)
    
    table.cell(info_table, 0, 6, "Price vs Kijun", text_color=color.black, bgcolor=color.new(color.gray, 70))
    table.cell(info_table, 1, 6, close > baseLine ? "ABOVE" : "BELOW", text_color=close > baseLine ? color.green : color.red)
    
    table.cell(info_table, 0, 7, "Last Signal", text_color=color.black, bgcolor=color.new(color.gray, 70))
    table.cell(info_table, 1, 7, long_condition ? "LONG" : short_condition ? "SHORT" : "NONE", 
               text_color=long_condition ? color.green : short_condition ? color.red : color.gray)

// ================================================================================
// ALERTS
// ================================================================================

// Alert conditions
alertcondition(long_condition, title="Long Entry Signal", 
               message="ZL-MACD+KJ+EOM Strategy: Long Entry Signal Triggered\nMACD: {{plot_0}}\nSignal: {{plot_1}}\nEOM: {{plot_2}}\nPrice: {{close}}\nKijun-Sen: {{plot_3}}")

alertcondition(short_condition, title="Short Entry Signal", 
               message="ZL-MACD+KJ+EOM Strategy: Short Entry Signal Triggered\nMACD: {{plot_0}}\nSignal: {{plot_1}}\nEOM: {{plot_2}}\nPrice: {{close}}\nKijun-Sen: {{plot_3}}")

// Position exit alerts
alertcondition(strategy.position_size[1] != 0 and strategy.position_size == 0, title="Position Closed", 
               message="ZL-MACD+KJ+EOM Strategy: Position Closed")