
Overview
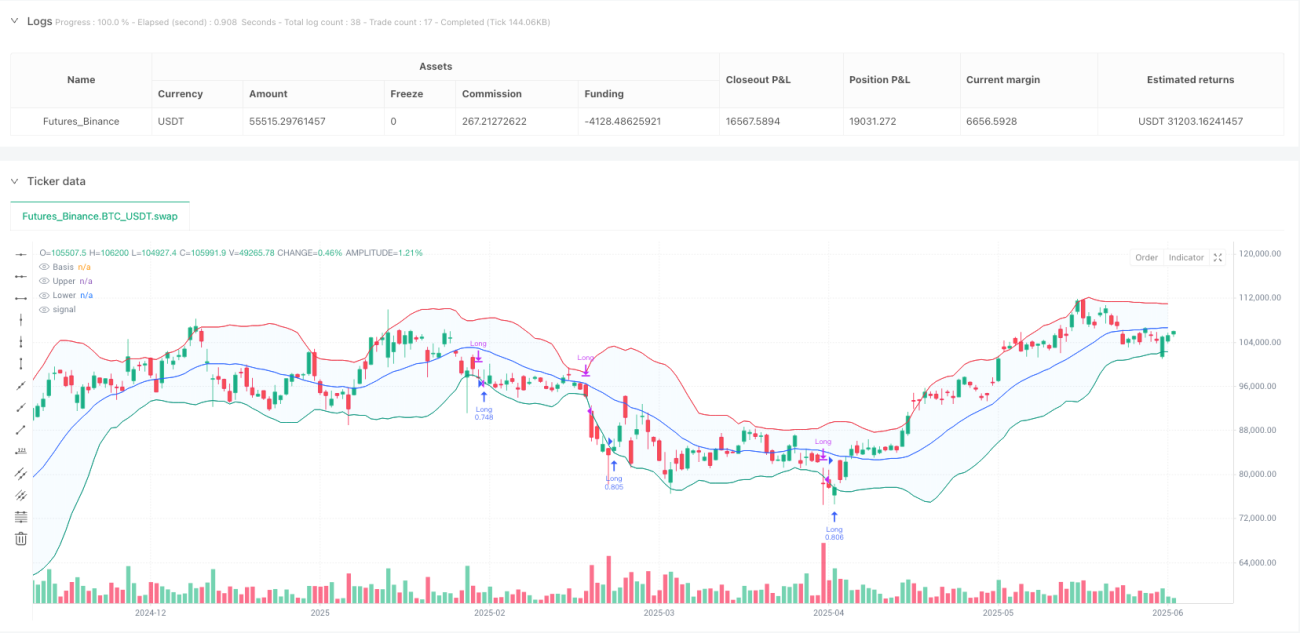
This strategy is a trend-following system based on Bollinger Bands, focusing on capturing strong upward momentum when price breaks above the upper band. The core idea is to enter long positions when the closing price breaks above the upper band, indicating a strong uptrend; and exit when the price falls below the lower band, either locking in profits or controlling risk. The strategy only executes long trades, avoiding short positions, making it particularly suitable for markets with distinct trending characteristics.
Strategy Principles
The strategy works based on the Bollinger Bands indicator, which consists of a middle band (moving average) and two standard deviation channels. The specific implementation is as follows:
- Middle Band Calculation: Default uses 20-period SMA (Simple Moving Average), but supports multiple types of moving averages (EMA, SMMA, WMA, VWMA)
- Volatility Calculation: Uses standard deviation multiplied by a factor of 2.0 to determine channel width
- Upper Band = Middle Band + (Standard Deviation × Multiplier)
- Lower Band = Middle Band - (Standard Deviation × Multiplier)
Entry Logic: When the closing price breaks above the upper band, the system recognizes this as a signal of strong upward momentum and immediately establishes a long position. This breakout often indicates positive market sentiment, and the price is likely to continue its upward trend.
Exit Logic: When the closing price falls below the lower band, the system determines that the bullish momentum has been exhausted or a reversal has occurred, and immediately closes the position. This design allows profits to run while exiting in a timely manner when the trend ends.
The strategy implements a time filter (2018 to 2069) in the code, allowing users to test strategy performance within specific time ranges, facilitating analysis across different market cycles.
Strategy Advantages
-
Clear and Precise Trading Signals: Entry and exit conditions are straightforward, eliminating complex judgments, reducing psychological pressure and decision-making difficulties for traders.
-
Strong Adaptability: By adjusting Bollinger Bands parameters (length, standard deviation multiplier, moving average type), the strategy can adapt to different market environments and volatility conditions.
-
Reasonable Risk Management: When a trend ends or reverses, the lower band exit mechanism effectively controls risk, avoiding deep drawdowns.
-
Captures Strong Trends: By focusing only on long positions, the strategy specializes in capturing major movements in uptrends, avoiding additional risks associated with short selling.
-
Customizable Parameters: Offers various adjustable parameters, including Bollinger Band length, standard deviation multiplier, moving average type, etc., allowing traders to optimize for different instruments and timeframes.
-
Visually Intuitive: The strategy retains the original Bollinger Bands indicator visualization, allowing traders to observe entry and exit signals intuitively.
Strategy Risks
-
False Breakout Risk: In oscillating markets, prices may frequently break above the upper band only to quickly fall back, leading to frequent trades and losses. Solution: Add additional filtering conditions, such as requiring two consecutive periods breaking above the upper band before entry, or combining with other indicators like RSI for confirmation.
-
Trend Reversal Risk: Market trends may reverse before prices touch the lower band, resulting in profit retracement. Solution: Consider adding trailing stops or setting profit targets to avoid waiting for prices to reach the lower band before exiting.
-
Reliance on a Single Indicator: The strategy relies solely on Bollinger Bands without other confirmation mechanisms, potentially leading to false signals. Solution: Combine with volume and momentum indicators (such as MACD, RSI) as additional confirmation tools.
-
Parameter Sensitivity: Improper Bollinger Bands parameter settings may result in too many or too few trading signals. Solution: Find optimal parameter combinations through historical data backtesting and regularly check parameter effectiveness.
-
Lack of Stop-Loss Mechanism: By default, the strategy only exits when price touches the lower band, without a clear stop-loss setting. Solution: Add fixed stop-losses or ATR-based dynamic stop-losses to control risk per trade.
Optimization Directions
-
Add Trend Confirmation Mechanism: Incorporate longer-period moving average direction or ADX indicator, executing long trades only when the major trend is upward, avoiding frequent trading in sideways or downtrend markets. This can improve win rate and returns, as trend-following strategies perform best in strong trending markets.
-
Optimize Entry Timing: The current strategy enters directly when price breaks above the upper band. Consider waiting for minor pullbacks before entry, or using the percentage distance between price and upper band as an entry condition to obtain better entry prices.
-
Improve Stop-Loss Mechanism: Implement ATR-based dynamic stop-losses or trailing stops to maintain trend profits while controlling risk earlier. This is particularly important for avoiding significant drawdowns, especially in highly volatile markets.
-
Add Volume Confirmation: When an entry signal appears, require volume to simultaneously increase to confirm the validity of the breakout. Volume is an important confirmation factor for price movements and can effectively filter out false breakouts.
-
Timeframe Optimization: Add multi-timeframe analysis functionality to the code, executing trades only when bullish signals appear across multiple timeframes. This "timeframe consistency" can significantly improve the reliability of the strategy.
-
Add Volatility Filtering: Adjust strategy parameters or pause trading in extremely high or low volatility environments, as Bollinger Bands perform differently across varying volatility conditions.
Summary
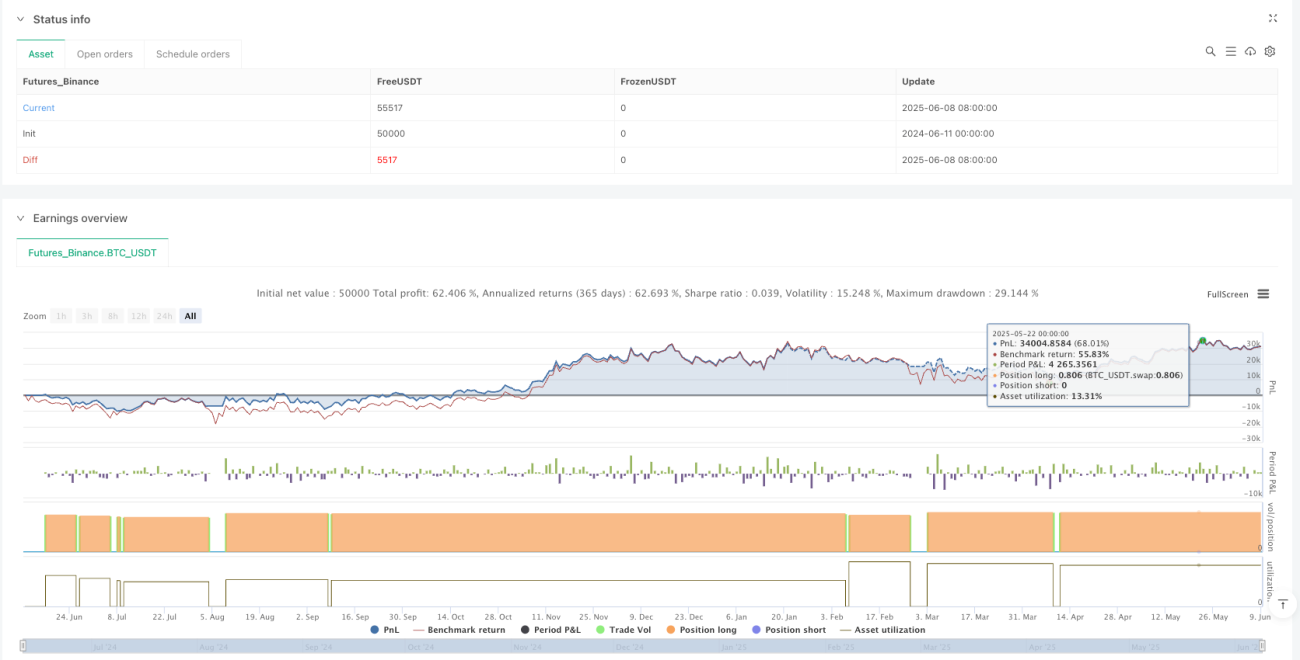
The Multi-Period Bollinger Breakout Momentum Capture Strategy is a trading system focused on capturing strong uptrends. Through breakout and breakdown signals from the upper and lower Bollinger Bands, the strategy can enter at the beginning of trends and exit when trends end, making it both simple and effective.
This strategy is best applied to markets with distinct trending characteristics and mitigates additional risks associated with short selling by focusing solely on long positions. Although risks such as false breakouts and reliance on a single indicator exist, improvements can be made by adding confirmation indicators, optimizing stop-loss mechanisms, and incorporating multi-timeframe analysis.
For traders, this strategy provides a clear framework, particularly suitable for medium to long-term trend trading. By properly setting parameters and adding necessary risk control measures, stable results can be achieved in actual trading. Most importantly, the strategy's flexibility allows for adjustments based on different market environments, maintaining long-term effectiveness.
/*backtest
start: 2024-06-11 00:00:00
end: 2025-06-09 08:00:00
period: 1d
basePeriod: 1d
exchanges: [{"eid":"Futures_Binance","currency":"BTC_USDT"}]
*/

//@version=5
strategy(shorttitle="BB Strategy-iNsTiNcT", title="iNsTiNcT - Bollinger Bands Strategy", overlay=true, commission_type=strategy.commission.percent, commission_value=0.1, slippage=0, default_qty_type=strategy.percent_of_equity, default_qty_value=100)

// Inputs- 1