Multi-Timeframe Heikin Ashi EMA Crossover Strategy with Volatility-Adaptive Risk Management

Overview
The Multi-Timeframe Heikin Ashi EMA Crossover Strategy with Volatility-Adaptive Risk Management is a trend-following approach that combines multi-timeframe analysis, Heikin Ashi candlesticks, and exponential moving average crossovers. This strategy filters market noise through Heikin Ashi candlesticks, determines trend direction using EMA crossovers, and confirms entry signals with higher timeframe structure. Additionally, it employs ATR-based dynamic stop-loss and take-profit levels, allowing risk management to automatically adjust according to market volatility. The strategy also features session time filtering, enabling traders to focus on specific trading sessions such as U.S. market hours. Through this multi-layered confirmation mechanism and adaptive risk management, the strategy aims to capture strong trends while effectively controlling risk.
Strategy Principles
The core principles of this strategy are based on multi-layered trend confirmation and dynamic risk management:
-
Heikin Ashi Candlestick Analysis: The strategy uses Heikin Ashi candlesticks instead of traditional candlesticks. This special calculation method ((open+high+low+close)/4) smooths price fluctuations, providing a clearer view of trends. The relationship between the Heikin Ashi open and close prices is used to determine the bullish or bearish nature of the current candle.
-
EMA Crossover Signals: The strategy utilizes crossovers between a fast EMA (default 9-period) and a slow EMA (default 21-period) to determine trend direction. When the fast EMA crosses above the slow EMA, it generates a long signal; when the fast EMA crosses below the slow EMA, it generates a short signal.
-
Multi-Timeframe Confirmation: The strategy checks the Heikin Ashi state in a higher timeframe (default 60-minute) to ensure trades are only executed when the trend direction in both the current timeframe and the higher timeframe align. This multi-timeframe analysis approach helps reduce false signals and ensures that trading direction is consistent with the primary trend.
-
ATR-Adaptive Stop-Loss/Take-Profit: The strategy uses the Average True Range (ATR) indicator to dynamically set stop-loss and take-profit levels. The stop-loss distance is 1.5 times the ATR, while the take-profit distance is 2.5 times the ATR. This volatility-based approach ensures that risk management parameters can adapt to changes in volatility across different market conditions.
-
Time Filter: The strategy allows users to set specific trading sessions (default is 9:00 to 16:00 Eastern Time), to focus on active market hours or avoid periods of lower volatility.
The trading logic is as follows:
- Long condition: Bullish Heikin Ashi (close > open) + Fast EMA > Slow EMA + Higher timeframe Heikin Ashi is bullish + Within set trading session
- Short condition: Bearish Heikin Ashi (close < open) + Fast EMA < Slow EMA + Higher timeframe Heikin Ashi is bearish + Within set trading session
Strategy Advantages
Through in-depth code analysis, this strategy demonstrates the following clear advantages:
-
Reduced False Signals: The smoothing characteristics of Heikin Ashi candlesticks combined with EMA crossovers and multi-timeframe confirmation significantly reduce false signals, improving signal quality. This multi-layer filtering mechanism ensures that only strong trend signals trigger trades.
-
Adaptive Risk Management: ATR-based stop-loss and take-profit levels automatically adjust according to market volatility, meaning that in highly volatile markets, stop-loss distances increase accordingly to avoid being hit by normal market fluctuations; while in less volatile markets, stops are tighter, improving capital efficiency.
-
Flexible Parameter Settings: The strategy offers rich customization options, including EMA periods, ATR parameters, time filters, and higher timeframe settings, allowing traders to adjust according to different markets and personal risk preferences.
-
Powerful Visual Aids: The strategy includes various visualization tools such as entry arrows, EMA lines, stop-loss/take-profit levels, and Heikin Ashi close lines, helping traders intuitively understand market behavior and trade execution.
-
Time Filter: Ability to focus on specific trading sessions, avoiding risks during low liquidity or high volatility periods, improving trading efficiency.
-
Complete Risk Control Chain: From entry signal screening to stop-loss and take-profit settings, to time filtering, forming a complete risk control chain that helps protect capital safety.
Strategy Risks
Despite the well-designed nature of this strategy, there are some potential risks:
-
Lag Risk: EMA, as a lagging indicator, may not respond timely in rapidly turning markets, leading to delayed entries or exits. While Heikin Ashi candlesticks can smooth prices, they also further increase this lag, potentially resulting in suboptimal entry points or missed important reversal signals.
-
Limitations of Fixed ATR Multipliers: Although ATR itself adapts to market volatility, fixed multipliers (such as 1.5x for stop-loss and 2.5x for take-profit) may not be suitable for all market environments. In certain extreme volatility or rapid one-directional markets, these settings may be either too conservative or too aggressive.
-
Multi-Timeframe Coordination Issues: Requiring confirmation from both the current timeframe and higher timeframe may miss some early opportunities, especially when a trend is just beginning to form and the higher timeframe has not yet turned.
-
Trading Frequency Limitations: While multi-layer filtering mechanisms improve signal quality, they may also significantly reduce trading frequency, potentially leading to long periods without trades in certain market environments.
-
Lack of Market State Recognition: The strategy does not explicitly distinguish between trending and ranging markets, which may generate too many false signals in ranging markets.
-
Parameter Optimization Challenges: Multiple parameters (EMA periods, ATR length, multipliers, etc.) need to be optimized for different markets and timeframes, which may lead to the risk of overfitting.
Methods to mitigate these risks include: conducting thorough backtesting and forward testing, adjusting parameters to suit specific markets, combining with other indicators or filters (such as market structure, volume confirmation), and implementing more flexible capital management strategies.
Strategy Optimization Directions
After analyzing the code, here are several directions for optimizing this strategy:
-
Dynamic EMA Periods: Consider automatically adjusting EMA periods according to market volatility, for example, using shorter EMA periods in low-volatility markets to increase sensitivity, and longer EMA periods in high-volatility markets to reduce noise. This can be achieved by calculating the ratio of ATR relative to its historical average.
-
Adaptive ATR Multipliers: The current strategy uses fixed ATR multipliers (1.5x for stop-loss, 2.5x for take-profit), which could be improved to dynamic multipliers based on market conditions. For instance, increasing the take-profit multiplier in strong trending markets and increasing the stop-loss multiplier in highly volatile markets.
-
Adding Volume Confirmation: Incorporating volume confirmation into entry signals can improve signal quality. For example, requiring volume to be above average during EMA crossovers, or confirming increased volume in the trend direction.
-
Market State Filter: Adding a filter to identify whether the market is in a trending or ranging state, and only trading during trending states or using different strategy parameters for different market states. This can be implemented using the ADX indicator or by analyzing price position relative to a long-term moving average.
-
Partial Profit Taking and Trailing Stops: Improving the current fixed take-profit model by implementing a partial profit-taking strategy and trailing stops, to lock in some profits while allowing the remaining position to continue following the trend. This can be achieved by moving the stop-loss to the entry point or key support/resistance levels after reaching a certain profit.
-
Smart Time Filtering: The current time filter is based on fixed times and could be improved to an adaptive filter based on market activity, such as dynamically adjusting trading sessions according to volume, volatility, or specific market events (like economic data releases).
-
Entry Optimization Based on Market Microstructure: Building on current signals by adding market microstructure analysis, such as waiting for pullbacks to key support/resistance levels or specific price patterns to form before entering, to obtain better entry prices.
These optimization directions aim to improve the strategy's adaptability, robustness, and profitability while reducing false signals and unnecessary risks. When implementing these optimizations, their effectiveness should be verified through rigorous backtesting and forward testing.
Summary
The Multi-Timeframe Heikin Ashi EMA Crossover Strategy with Volatility-Adaptive Risk Management is a well-designed trend-following system that effectively filters market noise and captures strong trends by combining Heikin Ashi candlesticks, EMA crossovers, and multi-timeframe confirmation. A notable feature of this strategy is its ATR-based adaptive risk management, which allows stop-loss and take-profit levels to automatically adjust according to market volatility. Additionally, the time filter function allows traders to focus on specific market sessions, further optimizing trading efficiency.
While the strategy's multi-layered confirmation mechanism reduces false signals, it may also lead to fewer trading opportunities and delayed entries. Meanwhile, fixed ATR multipliers and lack of market state recognition are aspects that need further optimization. By implementing dynamic parameter adjustments, adding volume confirmation, introducing market state filters, and improving profit-taking mechanisms, this strategy has the potential to further enhance its adaptability and profitability while maintaining its original advantages.
Overall, this is a clearly structured and logically sound trend-following strategy suitable for medium to long-term traders, especially those looking to capture sustained trends on larger timeframes. With appropriate parameter adjustments and optimizations, this strategy can adapt to various market environments and become a powerful tool in a trader's arsenal.
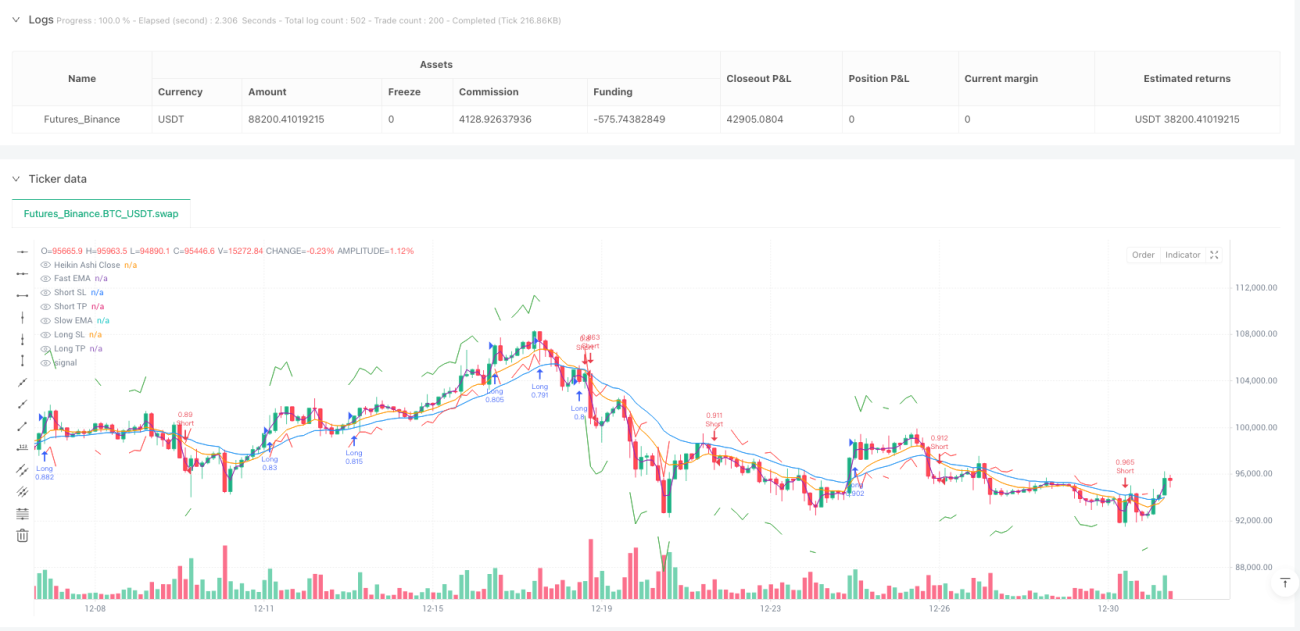
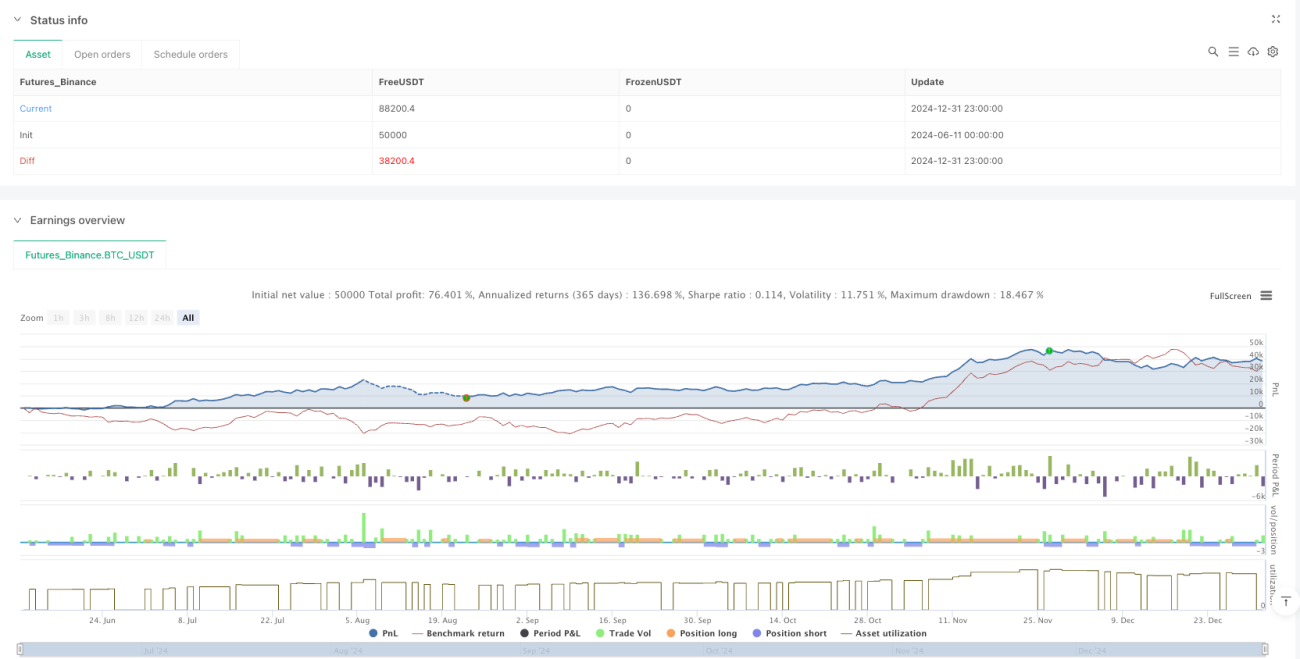
/*backtest
start: 2024-06-11 00:00:00
end: 2025-01-01 00:00:00
period: 3h
basePeriod: 3h
exchanges: [{"eid":"Futures_Binance","currency":"BTC_USDT"}]
*/

//@version=6
strategy("HA EMA Cross MTF Strategy + ATR SL/TP + Visuals", overlay=true, default_qty_type=strategy.percent_of_equity, default_qty_value=100)

// === INPUTS ===- 1