
Overview
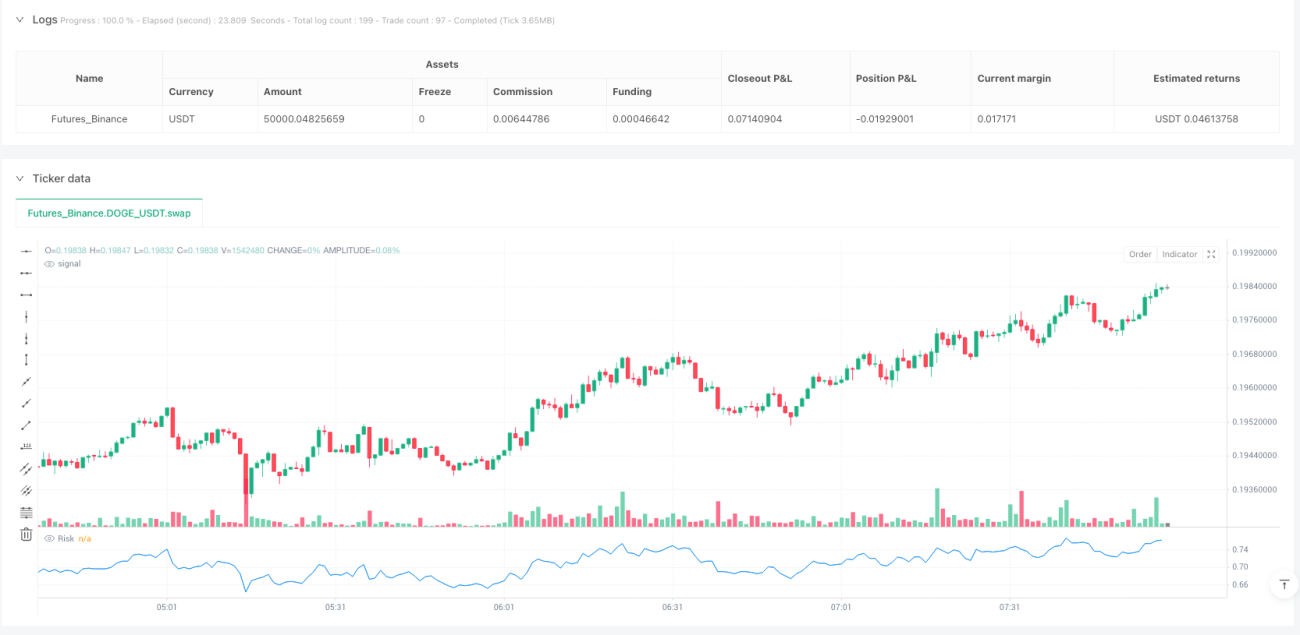
The Normalized Risk Value Dynamic Threshold Trading Strategy is a quantitative trading method based on the deviation between price and long-term moving average. This strategy calculates the logarithmic difference between the current price and the 374-period simple moving average, normalizes it, and produces a risk indicator between 0 and 1. When the risk value falls below specific thresholds, the strategy considers market risk to be low and suitable for long positions; when the risk value exceeds certain thresholds, the strategy considers market risk to be high and suitable for short positions or closing existing positions. The strategy also incorporates a fixed point stop-loss mechanism to effectively control individual trade risk, making it suitable for medium to long-term traders looking to identify market overbought and oversold areas.
Strategy Principle
The core principle of this strategy is to quantify market risk status through a normalized risk value, which then guides trading decisions. The specific calculation steps are as follows:
- Calculate a 374-period simple moving average (SMA) as a long-term trend reference baseline.
- Calculate the logarithmic difference between the current closing price and the 374-period SMA, multiplied by a time factor (bar_index raised to the power of 0.395), to obtain the original risk value.
- Track and record the historical highest point (ATH) and lowest point (ATL) of the original risk value.
- Normalize the original risk value to standardize its range between 0 and 1.
- Set different trading thresholds based on the normalized risk value:
- Risk value below 0.3: Triggers a buy signal
- Risk value above 0.6 or 0.7: Triggers an exit long signal
- Risk value above 0.7: Triggers a sell signal
- Risk value below 0.4: Triggers an exit short signal
The strategy also sets a fixed point (5 points) stop-loss mechanism to control the maximum loss of a single trade. Additionally, the strategy uses labels to visually display various signal positions on the chart, making it easier for traders to identify potential trading opportunities.
Strategy Advantages
-
Risk Quantification: Through normalization, complex market conditions are simplified into a risk indicator between 0-1, making it intuitive and easy to understand for trading decisions.
-
Adaptability: Using historical highest and lowest points for normalization allows the indicator to adapt to different market environments and cycle characteristics, avoiding the limitations of fixed parameters.
-
Mean Reversion Principle: The strategy judges overbought and oversold conditions based on the degree to which price deviates from the long-term average, aligning with the mean reversion characteristic of financial markets.
-
Time Factor Adjustment: By introducing a time factor (bar_index raised to the power of 0.395), the risk calculation dynamically adjusts with time progression, better reflecting market evolution patterns.
-
Risk Management Mechanism: Built-in stop-loss settings directly control the maximum loss amount of a single trade, helping to protect capital safety.
-
Visual Signals: Clearly marking various signal positions through labels reduces the difficulty of judgment for traders and enhances the practicality of the strategy.
-
Parameter Simplicity: With relatively few core parameters, the risk of overfitting is reduced, improving the strategy's adaptability under different market conditions.
Strategy Risks
-
Lag in Long-Term Moving Average: The 374-period SMA has significant lag, which may cause delayed signals in rapidly changing markets, missing optimal entry or exit opportunities.
-
Fixed Stop-Loss Not Adapting to Volatility: The strategy uses a fixed point value as the stop-loss standard without considering volatility differences across different markets and periods, potentially resulting in stop-losses that are either too loose or too tight.
-
Threshold Sensitivity: The trading signals heavily depend on preset risk thresholds (0.3, 0.4, 0.6, 0.7), and these fixed thresholds may not be applicable to all market environments.
-
Normalization Limitations: Using historical extreme values for normalization may require readjustment when new extreme market conditions occur, and insufficient historical data may lead to inaccurate normalization.
-
Backtest Bias Risk: The strategy relies on historical highest/lowest risk values, which may lead to look-ahead bias in forward-looking backtests, and actual application effects may not match backtest results.
-
Parameter Optimization Challenges: Key parameters such as SMA period, risk thresholds, stop-loss points, etc., need to be optimized for different markets, increasing the complexity of strategy tuning.
Solutions include: using adaptive stop-loss mechanisms instead of fixed point stop-losses; introducing volatility indicators to adjust risk thresholds; adopting multi-period signal confirmation; adding trend filtering conditions to avoid counter-trend trading; combining with other technical indicators for signal confirmation, etc.
Strategy Optimization Directions
-
Adaptive Stop-Loss Mechanism: Change the fixed point stop-loss to a dynamic stop-loss based on ATR (Average True Range), allowing the stop-loss level to automatically adjust according to market volatility, such as setting a stop-loss distance of 1.5 times ATR.
-
Dynamic Risk Thresholds: Replace the fixed risk thresholds (0.3, 0.4, 0.6, 0.7) with thresholds that dynamically adjust based on market conditions, considering using volatility or trend strength indicators to adjust these thresholds.
-
Add Trend Filters: Introduce trend judgment mechanisms, such as using longer-period moving average directions or the ADX indicator, to only trade in the direction of the main trend, avoiding counter-trend operations.
-
Signal Confirmation Mechanism: Increase signal confirmation requirements, such as requiring the risk indicator to remain beyond the threshold for multiple consecutive periods before triggering a signal, reducing false signals.
-
Add Time Filtering: Add trading time window restrictions to avoid known inefficient trading sessions or high volatility periods, improving signal quality.
-
Optimize Moving Average Period: Test different SMA periods (such as 200, 300, 450, etc.) to replace the fixed 374-period, finding parameters more suitable for specific markets.
-
Improve Capital Management: Introduce dynamic position management mechanisms to adjust the proportion of funds for each trade based on the absolute level and rate of change of the risk value, achieving risk balance.
-
Multi-Period Analysis Framework: Extend the strategy to consider risk indicators across multiple time periods, executing trades only when signals from different periods align, enhancing signal reliability.
These optimization directions aim to improve the strategy's adaptability, reduce false signals, optimize risk management, and enhance overall performance. By combining multiple optimization points, a more robust trading system can be constructed.
Summary
The Normalized Risk Value Dynamic Threshold Trading Strategy is a quantitative trading method based on the deviation between price and long-term moving average, guiding trading decisions by calculating and normalizing a risk indicator. This strategy simplifies complex market conditions into a risk value between 0-1, intuitively reflecting market overbought and oversold states.
The core advantages of the strategy lie in its adaptability and risk quantification capability, using dynamic tracking of historical extreme values for normalization, allowing the indicator to adapt to different market environments. Meanwhile, the built-in stop-loss mechanism provides basic risk control functionality.
However, the strategy also has limitations such as the lag of long-term moving averages, fixed thresholds, and stop-losses that do not adapt to market changes. To enhance strategy performance, consider introducing dynamic stop-loss mechanisms, adaptive risk thresholds, trend filters, and multi-period confirmation measures.
Overall, the Normalized Risk Value Dynamic Threshold Trading Strategy provides a systematic method to identify market risk status and guide trading decisions, suitable as an auxiliary tool for medium to long-term trading. Through reasonable parameter optimization and risk management, this strategy has the potential to maintain stable performance across different market environments.
- 1