Advanced Dynamic Trend Range Filtering Quantitative Trading Strategy

Overview
The Advanced Dynamic Trend Range Filtering Quantitative Trading Strategy is a trend-following system based on dynamic price volatility ranges. Its core concept involves constructing an adaptive price filtering mechanism through dual timeframe smoothed range calculations to effectively identify market trend changes and generate trading signals. The strategy utilizes exponential moving averages (EMAs) from fast and slow time periods to calculate price volatility ranges and creates trend range boundaries through a unique range filtering algorithm. When prices break through these boundaries, the system automatically generates buy or sell signals, helping traders capture trend reversal points while filtering out market noise. The strategy also provides intuitive chart visualization features, enabling traders to clearly identify trend direction, strength, and potential trading opportunities.
Strategy Principles
The core principle of this strategy is to establish a dynamic trend filter by calculating smoothed ranges of price volatility, implemented through the following steps:
-
Dual Range Calculation: The strategy uses two time periods (fast and slow) to calculate price volatility ranges. It first computes the absolute price change, then applies exponential moving averages (EMA) for smoothing, and finally adjusts the range size through custom multipliers.
-
Range Filter Application: The calculated smoothed range is applied to the price through the
apply_range_filterfunction, which ensures that the new filtered price doesn't deviate too far from the previous filtered price, thereby reducing false signals. -
Trend Identification: The strategy tracks consecutive increases or decreases in the filtered price to quantify trend strength and persistence.
-
Range Boundary Construction: Based on the filtered price and average smoothed range, the strategy calculates upper and lower boundaries. These boundaries dynamically adjust according to historical price behavior, forming the trend range filter.
-
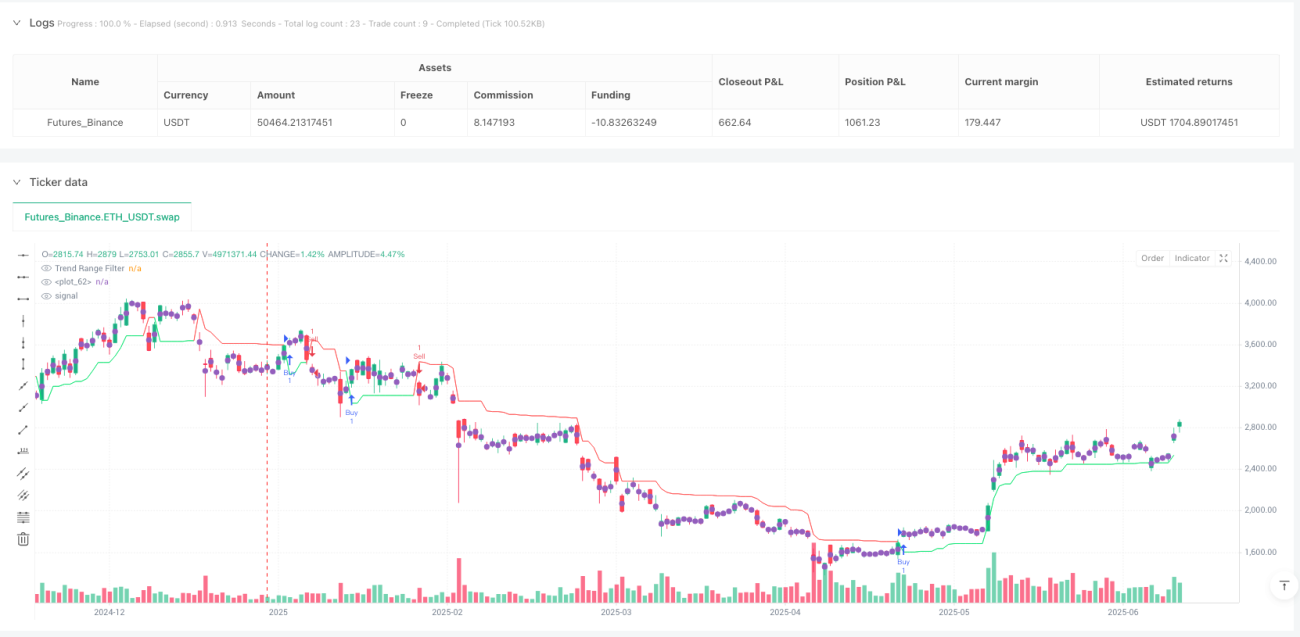
Signal Generation: Buy signals are generated when the closing price crosses above the trend range filter, and sell signals when it crosses below. These signals directly inform the entry and exit decisions of the trading strategy.
From the code implementation, the strategy uses multi-layered nested conditional logic to determine the value of the trend range filter, enabling the filter to adapt to different market conditions and improve signal reliability. The trend range filter essentially functions as an adaptive dynamic support and resistance line that automatically adjusts its sensitivity based on market volatility.
Strategy Advantages
A deep analysis of the strategy's code implementation reveals the following significant advantages:
-
Strong Adaptability: Through dual timeframe (fast and slow period) range calculations, the filter can automatically adapt to volatility changes under different market conditions. This adaptive characteristic allows the strategy to maintain relatively stable performance across various market environments.
-
Noise Filtering Capability: Through smoothed range calculations and conditional filtering mechanisms, the strategy effectively reduces the impact of market noise on trading decisions, lowering the frequency of false signals.
-
Trend Strength Quantification: By tracking consecutive increases or decreases in the filtered price, the strategy provides traders with quantitative indicators of trend strength, helping to assess the reliability of current trends.
-
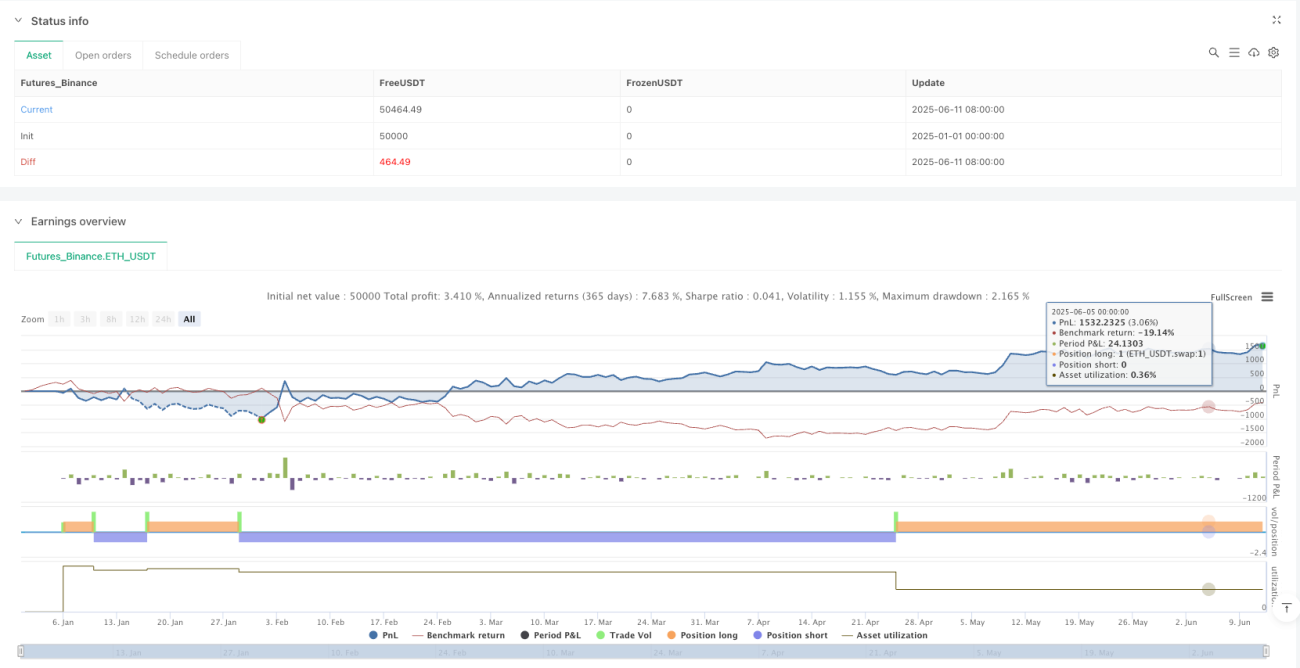
Visual Intuitiveness: The strategy marks buy and sell signals on the chart and fills different trend areas with colors, greatly improving the visual identification efficiency of trading opportunities.
-
Parameter Adjustability: The strategy offers multiple adjustable input parameters (such as fast/slow periods, range multipliers, etc.), allowing traders to optimize strategy performance for different trading instruments and timeframes.
-
Structured Code Design: The strategy adopts a modular design, encapsulating core calculation logic through custom functions, making the code easier to understand and maintain while facilitating subsequent expansion and optimization.
Strategy Risks
Despite its many advantages, the strategy also has potential risks and limitations:
-
Parameter Sensitivity: Strategy performance is highly dependent on the choice of input parameters. Different time period and multiplier settings may lead to completely different trading results. Traders need to conduct thorough backtesting and optimization to find the optimal parameter combination for specific markets.
-
Lag Risk: As the strategy uses EMAs for smoothing, it inevitably introduces a certain degree of lag, especially in cases of violent market fluctuations or rapid reversals, potentially causing delayed entry or exit signals.
-
False Breakout Risk: In range-bound or low-volatility markets, prices may frequently cross the trend range filter, generating multiple false signals, leading to frequent trading and increased transaction costs.
-
Lack of Stop-Loss Mechanism: The current strategy implementation lacks an explicit stop-loss mechanism, potentially facing significant losses in cases of sudden trend reversals. Traders are advised to supplement with appropriate risk management measures.
-
Single Signal Source: The strategy relies solely on price crosses with the trend range filter to generate signals, lacking auxiliary verification from other confirmation indicators, which may result in insufficient signal reliability.
To mitigate these risks, traders should consider adding additional filtering conditions, such as combining other technical indicators (like RSI, MACD, etc.) for signal confirmation, while implementing strict money management and stop-loss strategies.
Strategy Optimization Directions
Through in-depth analysis of the code implementation, the following potential optimization directions can be proposed:
-
Multiple Confirmation Mechanisms: Introduce additional technical indicators or conditions as signal confirmation, such as combining volume, momentum indicators, or market structure analysis to improve signal reliability. This can reduce false signals by executing trades only when multiple conditions are simultaneously satisfied.
-
Dynamic Parameter Adjustment: Implement automatic optimization mechanisms for parameters, enabling the strategy to automatically adjust fast/slow periods and multiplier values based on changing market conditions. For example, range multipliers could be dynamically adjusted based on market volatility indicators such as ATR.
-
Enhanced Risk Management: Add stop-loss and profit-taking mechanisms, such as setting dynamic stop-losses based on ATR, or using reverse crosses of the trend range filter as exit signals. Comprehensive risk management can significantly improve the strategy's risk-reward ratio.
-
Time Filtering: Add trading time window filters to avoid high-volatility periods such as market opening, closing, or important economic data releases, reducing false signals caused by abnormal fluctuations.
-
Trend Strength Filtering: Utilize the already calculated upward/downward trend counts to set minimum trend strength thresholds, generating trading signals only when trends are strong enough, avoiding excessive trading in weak trend or range-bound markets.
-
Machine Learning Optimization: Consider introducing machine learning algorithms to train models through historical data, optimizing parameter selection or improving signal identification accuracy. For example, random forests or support vector machines could be used to predict signal reliability.
Implementing these optimization directions can significantly enhance the strategy's stability and profitability, enabling it to maintain good performance across different market environments.
Summary
The Advanced Dynamic Trend Range Filtering Quantitative Trading Strategy is a trend-following system based on dynamic price ranges, constructing a flexible trend identification mechanism through dual timeframe adaptive range calculations. The core advantages of this strategy lie in its powerful adaptability and noise filtering capabilities, effectively identifying trend changes and generating trading signals under various market conditions.
The strategy establishes dynamic trend range boundaries by calculating smoothed ranges for fast and slow time periods, combined with a unique range filtering algorithm. When prices cross these boundaries, the system automatically generates buy or sell signals, helping traders capture trend reversal points. Meanwhile, the strategy's chart visualization features allow traders to intuitively identify market trends and potential trading opportunities.
Despite its many advantages, the strategy also faces risks such as parameter sensitivity, lag, and false breakouts. By introducing multiple confirmation mechanisms, dynamic parameter adjustments, enhanced risk management, and other optimization measures, the strategy's stability and profitability can be further improved.
Overall, this is a well-designed and thoroughly implemented quantitative trading strategy, suitable for experienced traders to apply in actual trading after comprehensive backtesting and parameter optimization. For traders pursuing trend following and dynamic adaptation to market changes, this strategy represents a worthy consideration.
- 1