Multi-Indicator Fusion Intraday Trading Dynamic Trailing Strategy

Overview
The Multi-Indicator Fusion Intraday Trading Dynamic Trailing Strategy is a quantitative trading method designed for disciplined intraday traders, aiming to transform small capital into substantial gains through calculated, high-probability trades. This strategy integrates Bollinger Bands, Relative Strength Index (RSI), Stochastic RSI, and Volume Spike detection to form a multi-dimensional trading decision system. The strategy features built-in stop-loss and take-profit mechanisms based on a configurable risk/reward ratio, defaulted to 1:2, along with dynamic trailing stop logic to protect and expand profits once positions become profitable. This strategy is particularly suitable for short-term trading and scalping on highly liquid assets, providing a systematic solution for traders looking to grow their accounts from small capital through disciplined trade management.
Strategy Principles
The strategy relies on the collaborative confirmation of multiple technical indicators to identify potential trading opportunities, with core trading logic as follows:
-
Long Entry Conditions:
- Price below the lower Bollinger Band (oversold area)
- RSI value less than 40 (relative weakness)
- Both K and D lines of Stochastic RSI below 20 (deep oversold)
- Detection of volume spike (trading activity confirmation)
-
Short Entry Conditions:
- Price above the upper Bollinger Band (overbought area)
- RSI value greater than 60 (relative strength)
- Both K and D lines of Stochastic RSI above 80 (deep overbought)
- Detection of volume spike (trading activity confirmation)
-
Risk Management Mechanism:
- Stop-loss set at 1% distance from current price
- Take-profit set based on risk-reward ratio, defaulted to 2 times the stop-loss distance
- Once the trade enters profit territory, trailing stop is activated, defaulted to 1.5% of price
From the code implementation, the strategy is written in PineScript version 5, including complete entry, exit, and risk management logic. Bollinger Bands parameters default to a 20-period moving average and 2 standard deviations, RSI period is 14, Stochastic indicator's K value is 14, and D value is 3. Volume spike is determined when current volume exceeds 1.5 times the 20-period average volume. The strategy also supports parameterized configuration, allowing traders to adjust various indicator sensitivities based on market characteristics and personal preferences.
Strategy Advantages
-
Multiple Confirmation Mechanism: Through comprehensive analysis of Bollinger Bands, RSI, Stochastic RSI, and volume in four dimensions, effectively filtering false signals that might be generated by single indicators, improving trading accuracy and reliability.
-
Strong Adaptability: The strategy can automatically detect suitable environments for long and short positions, adapting to different market cycles without requiring manual direction judgment from traders.
-
Comprehensive Risk Management: The built-in stop-loss, take-profit, and trailing stop mechanisms form a triple protection network, effectively controlling single-trade risk while maximizing potential returns. The trailing stop feature, in particular, can lock in more profits as the market continues to move in a favorable direction.
-
High Customizability: Traders can adjust the risk-reward ratio, trailing stop percentage, and parameters of various technical indicators according to personal risk preferences and market characteristics, making the strategy better adapt to different trading scenarios.
-
High Capital Efficiency: The strategy focuses on short-term high-probability trading opportunities, with high capital turnover rate, theoretically enabling rapid capital growth in a relatively short period.
-
Strong Execution Discipline: Algorithmic trading rules eliminate human emotional interference, ensuring consistency and discipline in trade execution, particularly suitable for traders with strong emotional tendencies.
Strategy Risks
-
False Breakout Risk: Despite using multiple indicators for confirmation, in highly volatile markets, prices may quickly revert after breaking through Bollinger Bands, leading to false signals. The solution is to add confirmation indicators or extend confirmation time, such as requiring prices to remain outside Bollinger Bands for a certain period before triggering signals.
-
Overtrading Risk: In oscillating markets, indicators may frequently trigger entry conditions, leading to overtrading and commission erosion. It is recommended to add a cooling period setting to limit the frequency of consecutive trades.
-
Parameter Sensitivity: Strategy performance highly depends on parameter settings, with different market environments potentially requiring different parameter combinations. It is necessary to seek robust parameter combinations through backtesting across multiple market cycles, or consider implementing adaptive parameter adjustment mechanisms.
-
Liquidity Risk: Although the strategy is designed for highly liquid assets, liquidity may suddenly decrease during specific periods (such as market opening, closing, or during major events), leading to increased slippage or orders not executing at expected prices. It is recommended to trade during high liquidity periods and set maximum acceptable slippage.
-
Technical Dependency: The strategy completely relies on technical indicators, ignoring the impact of fundamental factors on the market. Pure technical analysis may fail before and after major news or events. Consider adding event filters to pause automatic trading before and after significant events.
-
Tail Risk: The fixed 1% stop-loss setting may be insufficient to protect capital safety under extreme market conditions, especially in price gap or flash crash situations. It is recommended to combine with capital management principles, dynamically adjusting stop-loss distances based on market volatility, or setting the maximum single-trade risk as a percentage of total capital.
Strategy Optimization Directions
-
Dynamic Parameter Adjustment: Currently, the strategy uses fixed parameters, which can be optimized to automatically adjust Bollinger Bands width, RSI thresholds, and stop-loss distances based on market volatility. This can maintain stable performance across different market environments, such as narrowing Bollinger Bands width in low-volatility markets and expanding it in high-volatility markets.
-
Time Filter: Add trading time filters to avoid high-volatility periods before and after market opening and closing, as well as periods of lower liquidity. This will help reduce false signals and improve order execution quality, as market characteristics vary significantly across different time periods.
-
Trend Filter: Introduce longer-period trend indicators (such as moving average crossovers or ADX indicator) to ensure short-term trading direction aligns with overall market trends. This "trend-following" approach can improve the strategy's win rate and reduce the risk of counter-trend trading.
-
Capital Management Optimization: Currently, the strategy uses fixed proportion capital management (10% of account equity), which can be optimized to dynamic position adjustment based on the Kelly formula or fixed fraction method, automatically adjusting the capital proportion for each trade based on win rate and payoff ratio.
-
Multi-Timeframe Analysis: Integrate signal confirmation across multiple timeframes, for example, requiring indicators from both daily and hourly charts to support the trading direction. This approach can reduce false signals and improve trading probability advantages.
-
Machine Learning Enhancement: Introduce machine learning algorithms to analyze historical trading patterns, identify optimal parameter combinations and market conditions, and even predict which trading signals are more likely to succeed. As data accumulates, the system can continuously learn and self-optimize.
-
Volume Analysis Deepening: Currently, the strategy only uses simple volume spike detection, which can be expanded to more complex volume analysis, such as Volume Weighted Average Price (VWAP), Money Flow Index (MFI), or Accumulation/Distribution Line (A/D Line), to more precisely judge market force direction.
Summary
The Multi-Indicator Fusion Intraday Trading Dynamic Trailing Strategy is a comprehensive, logically rigorous quantitative trading system that integrates Bollinger Bands, RSI, Stochastic RSI, and volume analysis to identify high-probability trading opportunities while providing comprehensive risk management mechanisms. The strategy is particularly suitable for disciplined traders pursuing short-term, efficient trading, especially those hoping to gradually expand their capital through systematic methods.
The core advantages of this strategy lie in multi-dimensional signal confirmation and dynamic stop-loss protection, while the main risks come from parameter sensitivity and changing market conditions. By implementing the suggested optimization directions, especially dynamic parameter adjustment, multi-timeframe analysis, and machine learning enhancement, the strategy's robustness and adaptability can be further improved.
Ultimately, the successful implementation of this strategy depends not only on the algorithm itself but also on the trader's disciplined execution and continuous optimization. By strictly following strategy rules and continuously adjusting parameters and logic based on market experience, traders can achieve steady growth from small capital to substantial returns.
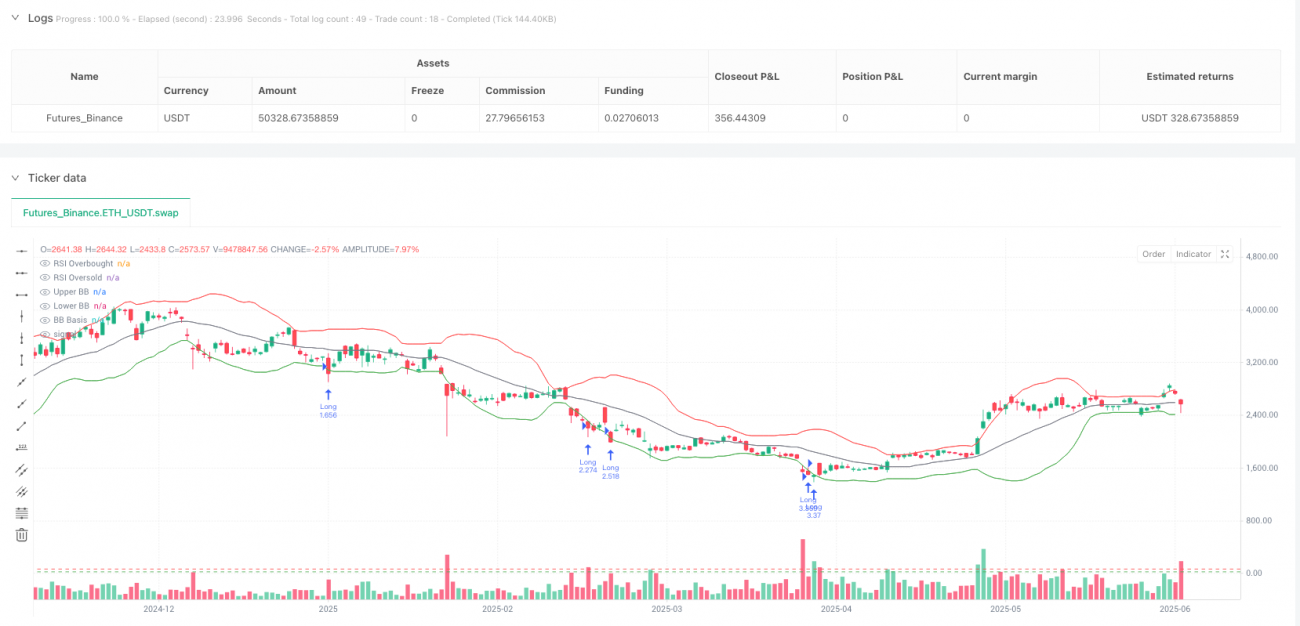
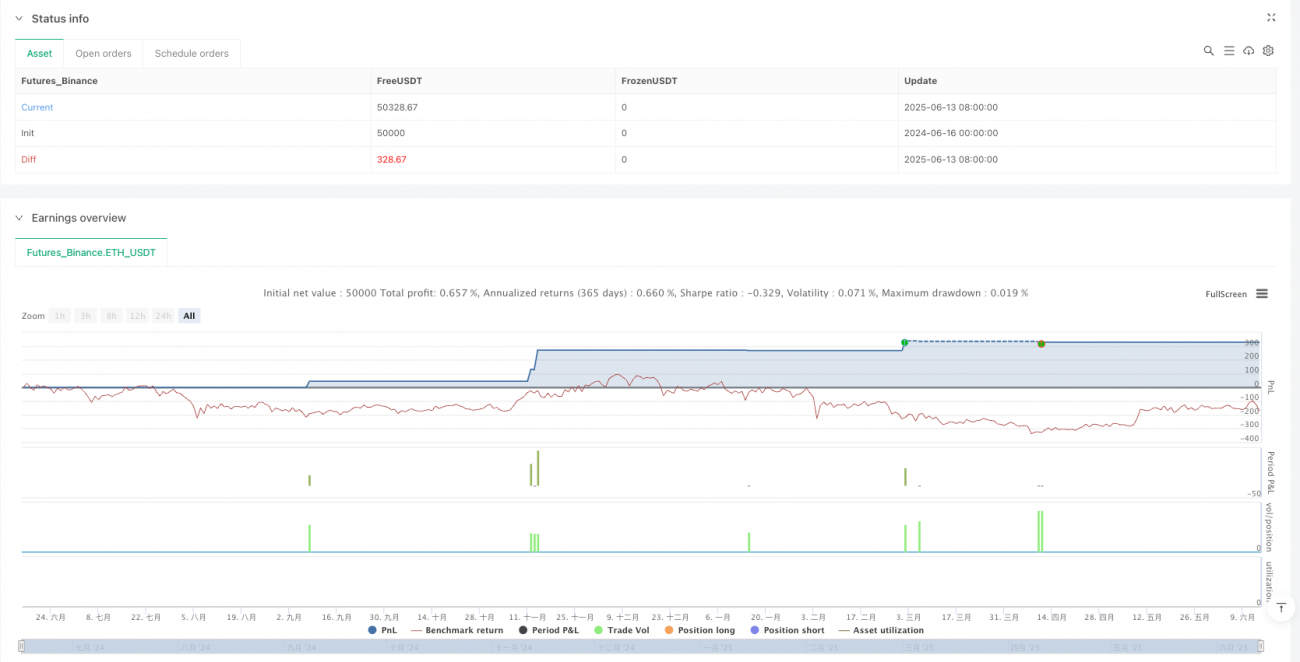
/*backtest
start: 2024-06-16 00:00:00
end: 2025-06-14 08:00:00
period: 1d
basePeriod: 1d
exchanges: [{"eid":"Futures_Binance","currency":"ETH_USDT"}]
*/

//@version=5
strategy("DAYTRADE GPT Strategy", overlay=true, default_qty_type=strategy.percent_of_equity, default_qty_value=10)

// === INPUT PARAMETERS ===- 1