Multi-Timeframe SMA-EMA Crossover Quantitative Strategy

Overview
The Multi-Timeframe SMA-EMA Crossover Quantitative Strategy is a technical analysis approach that combines Simple Moving Average (SMA) and Exponential Moving Average (EMA) crossover signals, enhanced with multi-timeframe filtering and RSI indicator confirmation. The core concept is to capture entry points at the crossover of EMA15 and SMA60, while using EMA200 as a long-term trend reference. The strategy incorporates higher timeframe EMA200 for trade direction filtering and uses the RSI indicator to avoid trading in overbought or oversold regions. Additionally, the strategy features comprehensive take-profit, stop-loss, and trailing stop mechanisms, along with session time control, forming a complete trading system.
Strategy Principles
The core principles of this strategy are based on several technical analysis components:
-
Moving Average Crossover System:
- Uses the crossover of 15-period EMA and 60-period SMA as the primary signal
- EMA15 crossing above SMA60 generates a long signal
- EMA15 crossing below SMA60 generates a short signal
- 200-period EMA serves as a long-term trend reference line
-
Multi-Timeframe Filtering:
- Incorporates a higher timeframe (default 60-minute) EMA200 as a trend determination tool
- Only allows long positions when price is above the higher timeframe EMA200
- Only allows short positions when price is below the higher timeframe EMA200
- This filtering mechanism ensures trade direction aligns with the larger timeframe trend
-
RSI Filtering Mechanism:
- Uses 14-period RSI indicator to avoid opening positions in overbought or oversold areas
- RSI below 30 indicates oversold conditions, restricting short entries
- RSI above 70 indicates overbought conditions, restricting long entries
- This design helps avoid counter-trend trading and improves entry quality
-
Risk Management System:
- Flexible take-profit settings, supporting both fixed points or percentage methods
- Fixed point stop-loss settings
- Trailing stop mechanism to lock in profits
- Session time control to avoid holding positions near market close
The trading logic follows a "trend following + multiple confirmation" approach, using multi-layer filtering to ensure trading only in high-probability directions, while implementing strict risk control measures to protect capital.
Strategy Advantages
Through deep code analysis, this strategy demonstrates the following significant advantages:
-
Multiple Confirmation Mechanism: Combines short-term moving average crossovers, long-term trend judgment, and RSI filtering to form a triple confirmation system, significantly improving signal quality and reducing false breakouts and erroneous signals.
-
Adaptability to Different Market Environments: Through parameterized design, the strategy can be flexibly adjusted to adapt to different market environments and trading instruments by modifying moving average periods, RSI thresholds, etc.
-
Comprehensive Risk Control:
- Supports multiple take-profit methods (fixed points/percentage)
- Fixed stop-loss to protect capital
- Trailing stops to lock in profits
- This multi-layered risk management mechanism effectively controls the maximum risk per trade
-
Session Time Management: Automatically closes positions at a specified time before market close, avoiding overnight risk and uncertainties from closing volatility, particularly suitable for intraday traders.
-
Higher Timeframe Trend Filtering: By incorporating higher timeframe trend determination, the strategy ensures trade direction aligns with the major trend, improving win rate.
-
Modular Design: Strategy components (signal generation, filtering mechanisms, risk management) are clearly separated, making it easy to understand and adjust, and facilitating subsequent optimization and expansion.
Strategy Risks
Despite its comprehensive design, the strategy still has the following potential risks:
-
Parameter Sensitivity: Strategy performance is highly dependent on moving average periods, RSI thresholds, and other parameter settings. Different market environments may require different parameter combinations, and improper parameter optimization could lead to overfitting historical data.
-
Lagging Issues: Moving averages are inherently lagging indicators, which may generate delayed signals in volatile or rapidly reversing markets, missing optimal entry points or leading to significant drawdowns.
-
Poor Performance in Ranging Markets: In markets lacking clear trends, moving average crossovers may produce frequent false signals, resulting in consecutive losses.
-
Over-reliance on Technical Indicators: The strategy is entirely based on technical indicators without considering fundamental factors and market sentiment, potentially underperforming in markets driven by major news or events.
-
Fixed Stop-Loss Risk: Fixed point stop-losses may not be flexible enough in markets with changing volatility – they might be too loose when volatility expands or too tight when volatility contracts.
Solutions:
- Backtest across different markets and periods to find robust parameter combinations
- Consider adding volatility-adaptive stop-loss mechanisms
- Add additional filtering conditions for ranging markets, such as volatility thresholds
- Enhance the strategy with fundamental factors or market sentiment indicators
- Consider adding volume confirmation mechanisms to improve signal quality
Strategy Optimization Directions
Based on the existing framework, here are several optimization directions worth considering:
-
Volatility Adaptive Mechanism:
- Introduce ATR (Average True Range) indicator to adjust stop-loss and take-profit levels
- Expand stop-loss range in high-volatility environments and tighten it in low-volatility environments
- This adaptive mechanism can better accommodate different market conditions
-
Multi-Timeframe Consistency Enhancement:
- Add intermediate timeframe confirmation, forming a "short-term + medium-term + long-term" triple timeframe consistency requirement
- Execute trades only when signals across multiple timeframes align
- This can further reduce false signal risk
-
Volume Confirmation:
- Add volume analysis, requiring increased volume when signals appear
- Utilize relative volume indicators such as OBV or Chaikin Money Flow
- Volume confirmation can significantly improve signal quality and breakout validity
-
Dynamic Parameter Optimization:
- Implement dynamic parameter adjustment mechanisms that automatically optimize moving average periods and RSI thresholds based on recent market performance
- This adaptive approach can help the strategy better adjust to changing market states
-
Market State Classification:
- Add a market state recognition module to distinguish between trending and ranging markets
- Apply different signal generation and filtering rules in different market states
- This dynamic adjustment can improve strategy adaptability across various market environments
-
Machine Learning Integration:
- Use machine learning algorithms such as decision trees or neural networks to optimize entry decisions
- Comprehensively consider additional factors like seasonality, market sentiment, and volatility
- This can enhance the strategy's predictive capability and adaptability
These optimization directions can address the strategy's weaknesses and improve its performance across a wider range of market environments.
Summary
The Multi-Timeframe SMA-EMA Crossover Quantitative Strategy is a well-structured, logically clear technical analysis trading system. It combines moving average crossover signals, multi-timeframe trend filtering, and RSI overbought/oversold judgment to form a multi-layered trading decision framework. The strategy also includes comprehensive risk management mechanisms, including various take-profit and stop-loss methods, as well as session time control.
The strategy's main advantages lie in its multiple confirmation mechanisms and comprehensive risk control, enabling it to perform exceptionally well in trending markets while effectively controlling risk. However, the strategy also faces issues such as high parameter sensitivity and poor adaptability to ranging markets.
There is significant room for improvement through introducing volatility adaptive mechanisms, strengthening multi-timeframe consistency requirements, adding volume confirmation, implementing dynamic parameter optimization, and other enhancements. These optimizations can help the strategy better adapt to different market environments and improve overall stability and profitability.
In summary, this is a well-designed trend-following strategy suitable for traders with a certain level of technical analysis foundation. With appropriate parameter adjustments and optimization, it can become a reliable trading tool, particularly well-suited for market environments with clear medium to long-term trends.
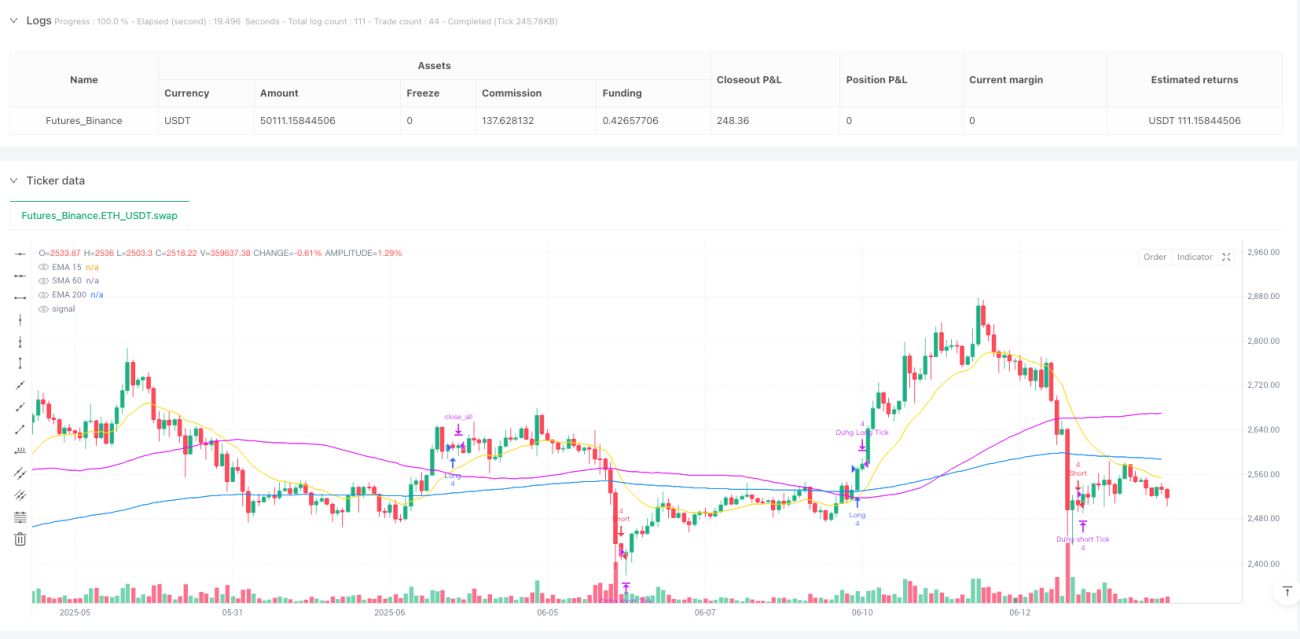
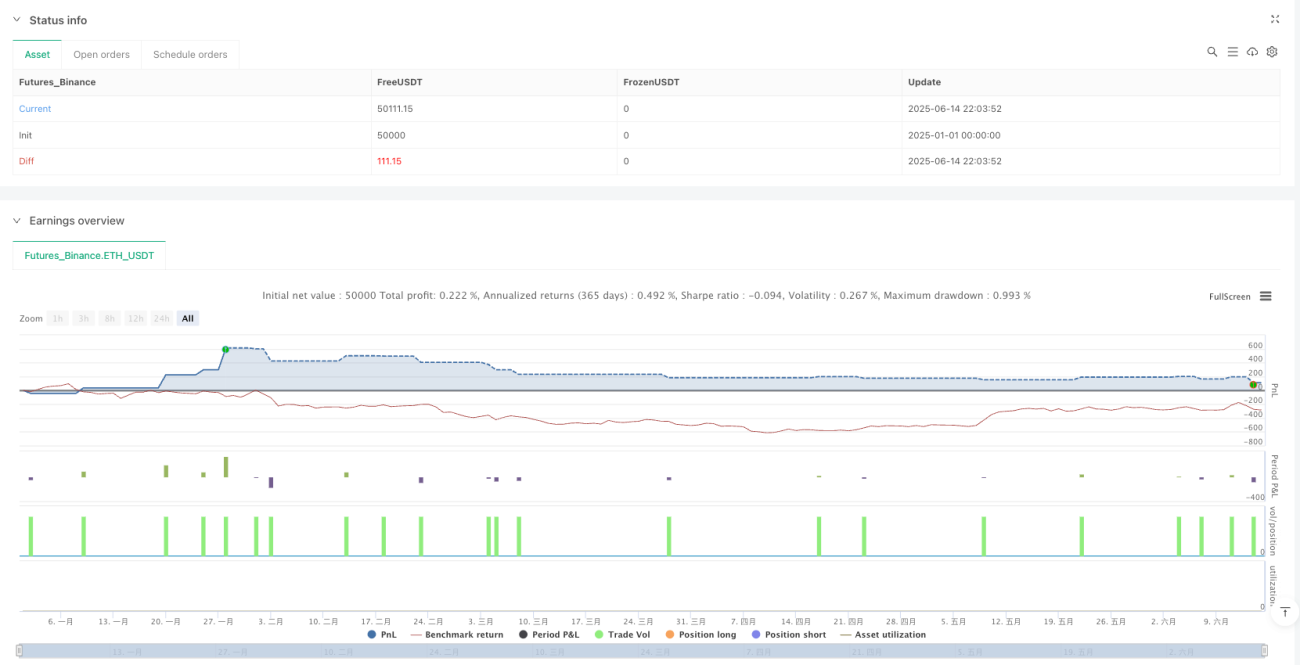
/*backtest
start: 2025-01-01 00:00:00
end: 2025-06-15 00:00:00
period: 2h
basePeriod: 2h
exchanges: [{"eid":"Futures_Binance","currency":"ETH_USDT"}]
*/

//@version=5
strategy(title="PhaiSinh_SMA & EMA [VNFlow]", overlay=true, slippage=1, backtest_fill_limits_assumption=1, initial_capital=100.000, default_qty_type=strategy.fixed, default_qty_value=4, commission_type=strategy.commission.cash_per_order, commission_value=2700,fill_orders_on_standard_ohlc=true, calc_on_order_fills=true, process_orders_on_close=true)

// === Chỉ báo chính ===- 1