
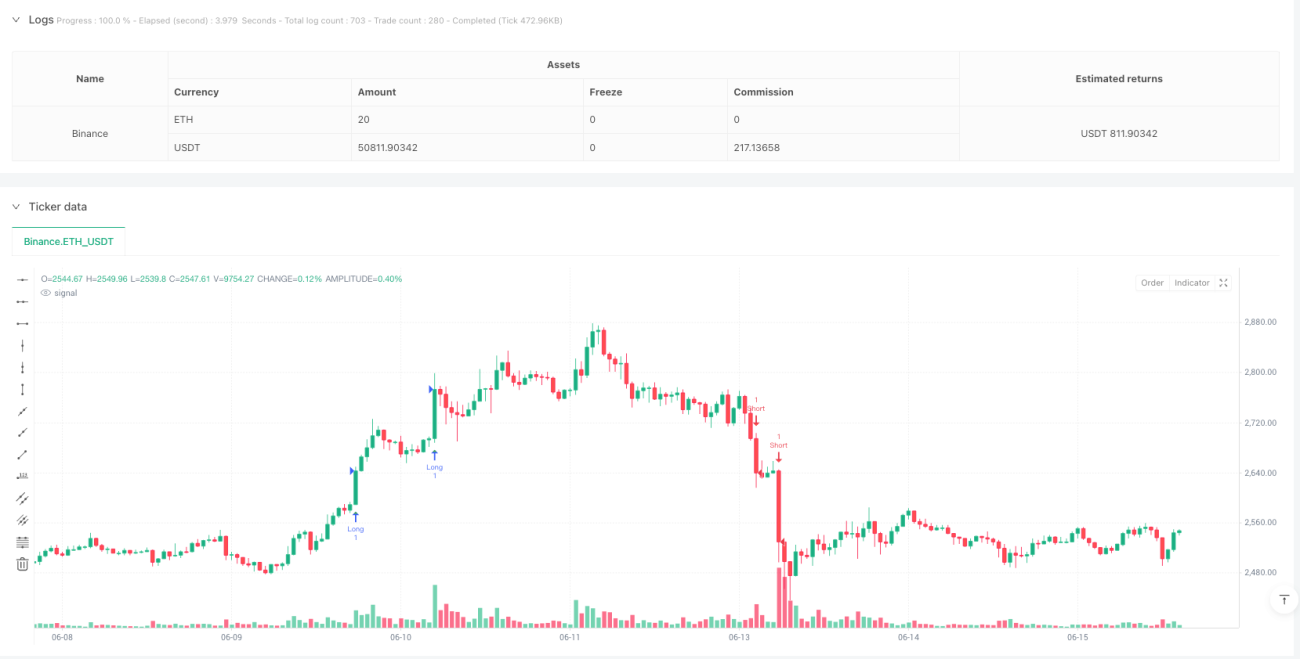
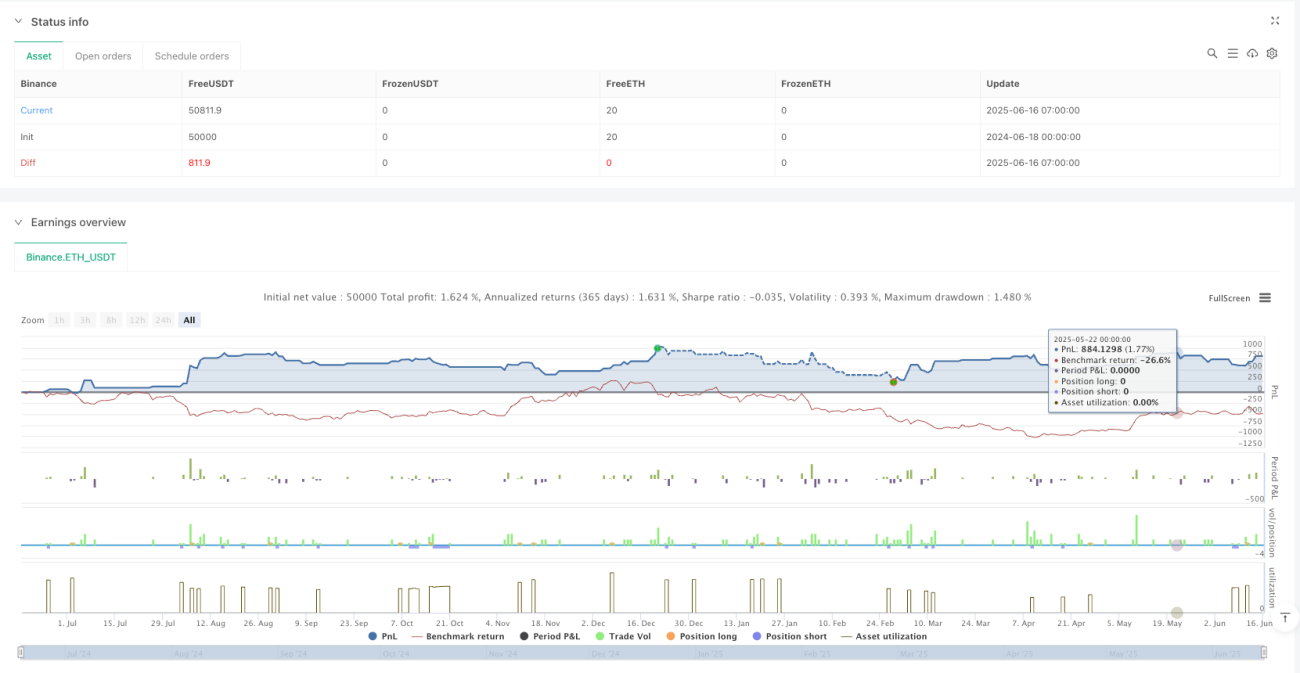
Overview
This strategy is a trend-following system based on price momentum and historical resistance/support breakouts. The core logic seeks to identify candles with significant price changes (≥2%) and combines them with breakouts of recent price highs/lows to confirm trend direction. Additionally, the strategy employs the Average True Range (ATR) indicator to dynamically set take-profit levels, while using the extreme points of momentum candles as stop-loss levels, creating a risk-controlled trade management mechanism.
Strategy Principles
The strategy operates on a 1-hour timeframe and is designed based on the following core principles:
-
Momentum Identification: The strategy first calculates the percentage price change of a single candle
(close-open)/open, identifying significant momentum when this change reaches or exceeds 2% (adjustable parameter). -
Breakout Confirmation:
- Long breakout: Price must break above the highest price of the past 10 candles (adjustable parameter)
- Short breakout: Price must break below the lowest price of the past 10 candles (adjustable parameter)
-
Entry Signal Generation:
- Long entry: When a candle with ≥2% upward momentum appears and the price breaks above the highest point of the previous 10 candles
- Short entry: When a candle with ≥2% downward momentum appears and the price breaks below the lowest point of the previous 10 candles
-
Dynamic Take-Profit Setting: Uses the ATR indicator (default 14 periods) multiplied by a factor (default 1.5) to determine the take-profit distance, allowing the take-profit level to automatically adjust according to market volatility.
-
Stop-Loss Strategy:
- Long stop-loss: Set at the lowest point of the momentum candle
- Short stop-loss: Set at the highest point of the momentum candle
The strategy also includes visual indicators that mark entry signals and take-profit/stop-loss trigger points on the chart, facilitating backtesting analysis for traders.
Strategy Advantages
-
Strong Market Adaptability: By using the ATR indicator to set take-profit levels, the strategy can automatically adapt to different market volatility environments, providing larger profit space in highly volatile markets and tightening take-profit positions in less volatile markets.
-
Bidirectional Trading Capability: The strategy supports both long and short trades, capturing opportunities in both uptrends and downtrends, maximizing market participation.
-
Objective Entry Criteria: Through clear momentum thresholds and breakout conditions, the strategy eliminates subjective judgment, making trading decisions more standardized and systematic.
-
Precise Risk Control: Stop-loss levels are set at the extreme points of momentum candles, both protecting capital and respecting market structure, avoiding premature stops due to random fluctuations.
-
Flexible Adjustable Parameters: The strategy provides multiple adjustable parameters (momentum threshold, lookback period, ATR length and multiplier), allowing traders to optimize adjustments based on their risk preferences and different market environments.
-
Rich Visual Feedback: Clearly displays entry signals and take-profit/stop-loss trigger positions through graphic markers, providing traders with intuitive understanding of strategy execution.
Strategy Risks
-
False Breakout Risk: In volatile markets without clear trends, frequent false breakout signals may occur, leading to consecutive stop-losses. Solution: Additional trend filters can be added, such as moving average direction confirmation or trend indicators.
-
Large Gap Risk: Markets may experience large gaps due to significant news impact, exceeding set stop-loss positions and causing actual losses to exceed expectations. Solution: Consider setting maximum loss amount or percentage limits, and reduce position size during extremely high volatility.
-
Parameter Sensitivity: Strategy performance is relatively sensitive to parameter settings, especially momentum threshold and ATR multiplier. Solution: Conduct thorough backtesting optimization to find relatively stable parameter combinations across different market environments.
-
Lack of Money Management: The strategy itself does not include detailed money management rules. Solution: Add position management mechanisms in practical application, such as position adjustments based on account equity ratio or fixed risk proportion.
-
Insufficient Multi-Timeframe Confirmation: Relying on a single timeframe may result in less robust trading signals. Solution: Consider adding multi-timeframe confirmation mechanisms, such as executing trades only when the trend direction is consistent in larger timeframes.
Strategy Optimization Directions
-
Add Trend Filters: Moving averages or other trend indicators can be added as directional filters, for example, executing long trades only when the price is above the 200-period moving average, and vice versa for short trades, which will significantly improve signal quality.
-
Introduce Volatility Filters: The strategy may not perform well in extremely high or low volatility markets. Volatility filtering conditions can be added, such as executing trades only when volatility indicators (like ATR/price ratio) are within specific ranges.
-
Optimize Take-Profit Mechanism: Implement stepped take-profits or trailing stops, for example, moving the stop-loss to breakeven when the price reaches 0.5x ATR profit, creating risk-free trades.
-
Add Trading Time Filters: Certain time periods (such as Asian, European, US trading sessions) may be more suitable for this strategy. Analyzing performance across different time periods and optimizing trading time windows can improve strategy win rates.
-
Integrate Volume Confirmation: Use volume as an auxiliary condition for breakout confirmation, entering only on high-volume breakouts to reduce false breakout risk.
-
Add Momentum Divergence Indicators: Introduce indicators such as RSI or MACD to detect price and momentum divergence, avoiding entries when momentum is weakening.
-
Intelligent Parameter Adjustment: Design an adaptive parameter system that automatically adjusts momentum thresholds and ATR multipliers based on recent market volatility, making the strategy more adaptable.
Conclusion
The Advanced Momentum Breakout Trading Strategy with ATR-Based Take Profit and Stop Loss Mechanism is a comprehensive trading system that identifies potential trend beginnings by capturing short-term price momentum and key price level breakouts. The core advantages of the strategy lie in its objective entry criteria and dynamic take-profit/stop-loss mechanism that adapts to market volatility, allowing it to maintain relatively stable performance across different market environments.
Although the strategy faces risks such as false breakouts and parameter sensitivity, its robustness and profitability can be significantly enhanced through optimization directions including trend filters, multi-timeframe confirmation, and volume verification. Particularly when combined with a well-developed money management system, this strategy has the potential to become a powerful weapon in a trader's toolkit.
For traders wishing to apply this strategy, it is recommended to first conduct thorough backtesting across different market environments to find parameter combinations that best suit their trading style and risk tolerance, and gradually introduce the aforementioned optimization measures to create a more personalized and efficient trading system.
- 1