Counter-Trend Moving Average and Candlestick Pattern Recognition Quantitative Trading Strategy

Overview
The "Counter-Trend Moving Average and Candlestick Pattern Recognition Quantitative Trading Strategy" is an innovative trading system that cleverly combines multiple Exponential Moving Averages (EMAs) with advanced candlestick pattern recognition techniques to capture reversal opportunities after market overextension by employing counter-trend trading principles. The core of this strategy lies in assessing trends formed by multi-period moving averages, while simultaneously identifying various classic candlestick patterns as confirmation conditions for trading signals, thereby executing counter-trend operations at high-probability market reversal points. The strategy also integrates comprehensive risk management mechanisms, including fixed stop-loss, target profit, and dynamic trailing stops, as well as daily trading limits and signal cooling periods, all designed to ensure long-term stable profitability.
Strategy Principles
The core principle of this strategy is built on the trading philosophy that "overextended markets will eventually revert," with specific implementation logic as follows:
-
Trend Identification System: By analyzing the positional relationships between 5 different period Exponential Moving Averages (EMAs of 20, 30, 40, 50, and 200), the strategy determines the current market trend. When shorter-period EMAs are sequentially positioned above longer-period EMAs, it defines a bullish trend; conversely, when shorter-period EMAs are sequentially positioned below longer-period EMAs, it defines a bearish trend.
-
Candlestick Pattern Recognition: The strategy integrates recognition algorithms for multiple classic candlestick patterns, including:
- Engulfing: When the current candle completely engulfs the body of the previous candle
- Doji: When opening and closing prices are extremely close
- Hammer and Shooting Star: Patterns with small bodies and long lower or upper shadows
- Morning Star and Evening Star: Three-candle reversal patterns
- Inside Bar and Outside Bar: When the current candle's high and low are completely within or surrounding the previous candle
- Pin Bar: Reversal patterns with long shadows
-
Counter-Trend Logic: Unlike traditional trend-following approaches, this strategy seeks long opportunities when bearish patterns appear in bearish trends, and short opportunities when bullish patterns appear in bullish trends. This counter-intuitive operation aims to capture rebound or pullback points after market overextension.
-
Entry Control Mechanism: The strategy implements a maximum trade limit (3 trades) per signal, introduces a cooling period (10 bars) between trades, and controls the maximum number of trades (5) per direction per day, effectively preventing overtrading.
-
Risk Management System: Employs multi-dimensional risk control measures, including fixed point stop-loss (2800 points), target profit (2000 points), and a trailing stop mechanism that activates after 65 points of profit, ensuring effective risk control while maintaining profitability.
Strategy Advantages
Through in-depth analysis, this strategy demonstrates the following significant advantages:
-
High Adaptability: The combination of multiple moving averages and various candlestick patterns provides comprehensive judgment, enabling the strategy to adapt to different market environments and changing conditions, enhancing its robustness.
-
Counter-Intuitive Edge: While most traders tend to follow trends, this strategy operates counter to them by identifying points of market overextension, capturing opportunities that conventional strategies might miss, giving it a unique market edge.
-
Multi-dimensional Confirmation Mechanism: Trading signals are triggered only when both trend conditions and pattern conditions are simultaneously satisfied, greatly improving signal reliability and reducing interference from false signals.
-
Flexible Risk Management: The strategy integrates a combination of fixed stop-loss, target profit, and trailing stop mechanisms, controlling losses when markets move adversely while securing profits and tracking continued movement when markets move favorably.
-
Anti-Overtrading Protection: By setting daily trading limits, signal cooling periods, and maximum trades per signal, the strategy effectively prevents overtrading in volatile markets, ensuring long-term stability.
-
Visual Intuitiveness: The strategy plots all used moving averages on the chart, allowing traders to visually observe market conditions and potential signals, aiding decision-making.
Strategy Risks
Despite its multiple advantages, the strategy still faces the following potential risks and challenges:
-
Strong Trend Risks: In strongly trending markets, counter-trend strategies may face consecutive losses. Although stop-loss mechanisms are in place, significant drawdowns may still occur in extreme market conditions. A solution is to add trend strength filters that temporarily disable counter-trend signals during extremely strong trends.
-
Parameter Sensitivity: Strategy performance heavily depends on parameter settings such as moving average periods, stop-loss/take-profit points, and trading limits. Different markets and timeframes may require different parameter combinations. Historical backtesting and optimization are recommended to find the most suitable parameter configuration for specific markets.
-
Pattern Recognition Errors: Candlestick pattern recognition based on fixed mathematical models may not fully capture all effective pattern variations in the market, resulting in possible false positives or missed opportunities. Consider introducing machine learning algorithms to improve pattern recognition accuracy.
-
Slippage and Trading Cost Impact: In actual trading, slippage and trading costs can significantly affect strategy profitability, especially for frequent trading strategies. It is advisable to include actual trading costs in backtests and consider reducing unnecessary trading frequency.
-
Market Environment Dependency: This strategy performs best in ranging or slightly trending markets but may underperform in suddenly strong trending or extremely low volatility markets. A market environment recognition mechanism could be introduced to automatically reduce trading frequency or pause trading under unfavorable market conditions.
Strategy Optimization Directions
Based on code analysis, the strategy can be optimized in the following directions:
-
Adaptive Parameter System: Introduce adaptive mechanisms to dynamically adjust moving average periods and stop-loss/take-profit levels, allowing the strategy to automatically optimize parameters based on changing market volatility. This can be implemented by incorporating the ATR (Average True Range) indicator, increasing stop-loss distances in high-volatility environments and decreasing them in low-volatility environments.
-
Timeframe Coordination: Introduce multi-timeframe analysis, requiring larger timeframe trend direction to align with the trading direction, or confirming patterns on larger timeframes to increase signal reliability. For example, confirm trend direction on daily charts while looking for entry points on hourly charts.
-
Pattern Strength Scoring: Introduce a strength scoring system for each candlestick pattern, assigning different weights based on pattern perfection, position, and prior price action, triggering trades only when pattern strength reaches a threshold. This helps filter weak signals and improves trade success rates.
-
Market Sentiment Integration: Incorporate market sentiment indicators such as Relative Strength Index (RSI), Stochastic, or Bollinger Bands, combining overbought/oversold conditions to further confirm reversal points and improve entry timing precision.
-
Dynamic Position Sizing: Replace fixed percentage position strategy with a dynamic position sizing system based on market volatility and signal strength, increasing position size when high-confidence signals appear and decreasing it for low-confidence signals, optimizing capital efficiency and risk-reward ratios.
-
Machine Learning Enhancement: Consider introducing machine learning algorithms to optimize pattern recognition and signal generation processes, training models on historical data to identify the most profitable trading opportunities, further enhancing the strategy's predictive capabilities and adaptability.
Summary
The "Counter-Trend Moving Average and Candlestick Pattern Recognition Quantitative Trading Strategy" is a comprehensive trading system based on technical analysis and counter-trend trading principles. Through carefully designed multiple moving average trend identification and candlestick pattern confirmation mechanisms, it executes counter-trend operations at key market reversal points, effectively capturing opportunities that traditional trend-following strategies might miss. The strategy incorporates comprehensive risk management and trade control systems, including stop-loss/take-profit, trailing stops, and trading frequency limitations, aiming to achieve long-term stable risk-adjusted returns.
Although this strategy performs excellently under specific market conditions, it still faces challenges such as risks in strong trending environments and parameter sensitivity. By introducing adaptive parameter systems, multi-timeframe analysis, pattern strength scoring, market sentiment indicator integration, and dynamic position sizing, strategy performance can be further improved. Ultimately, this strategy provides a valuable reference framework for quantitative traders seeking non-traditional trading methods, particularly suitable for those looking for high-probability reversal opportunities in overextended markets.
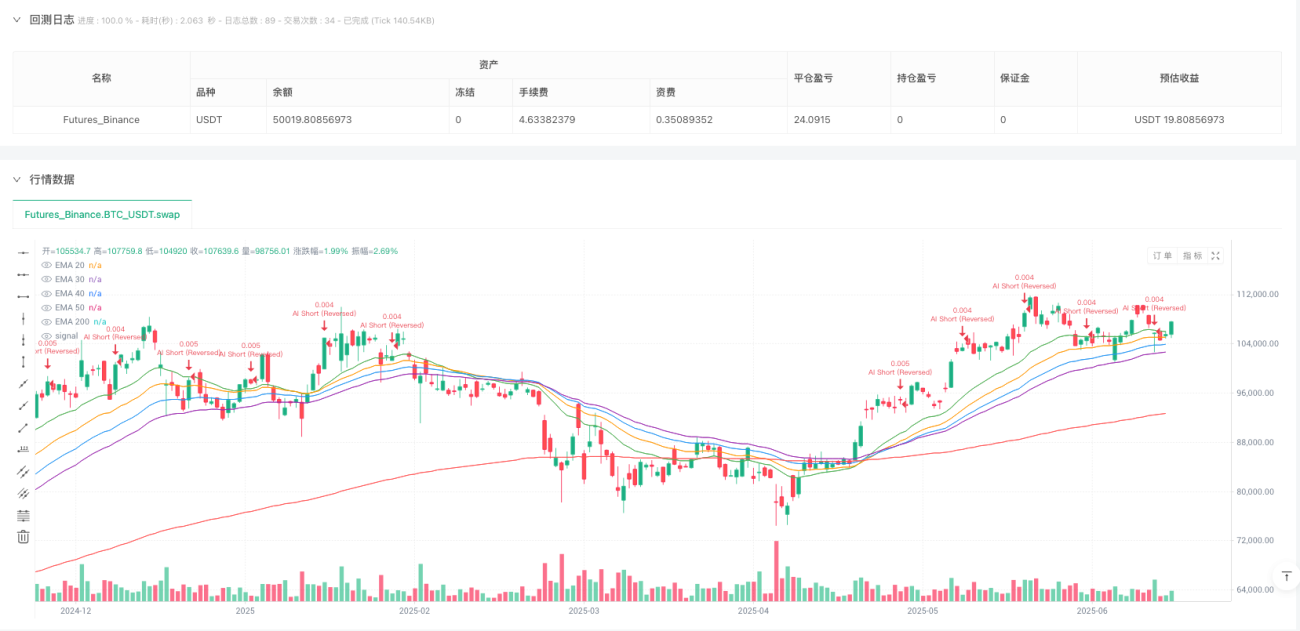
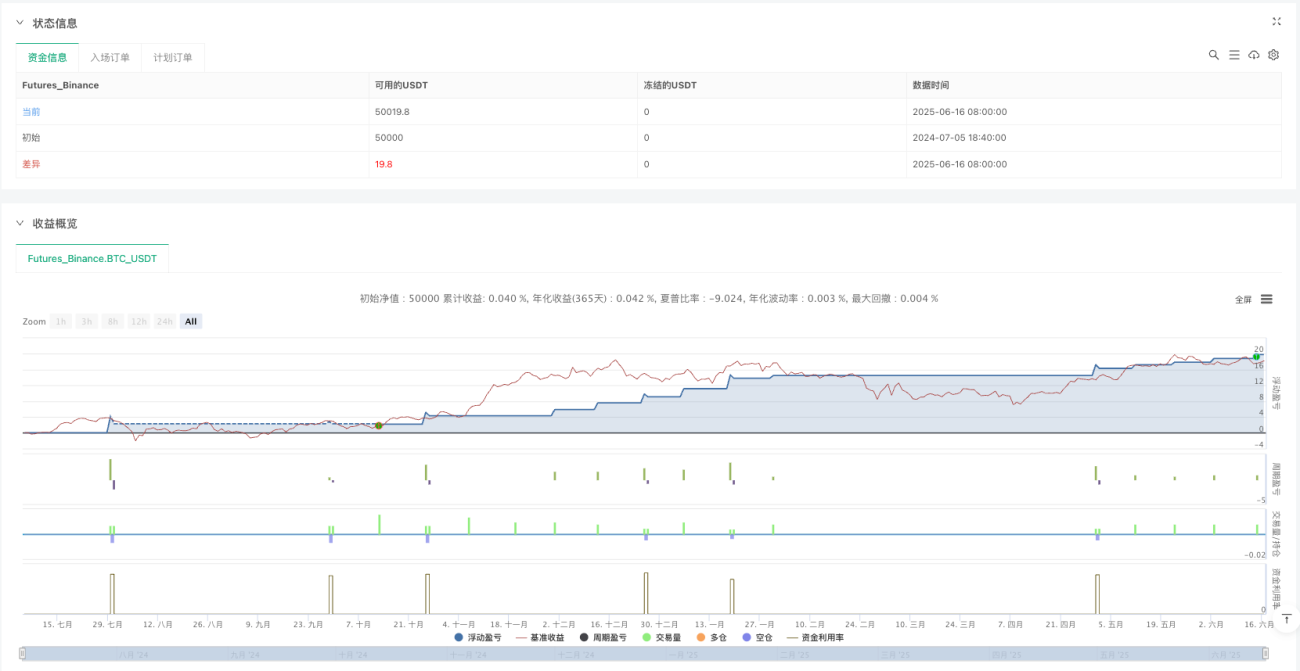
/*backtest
start: 2024-07-05 18:40:00
end: 2025-06-17 08:00:00
period: 1d
basePeriod: 1d
exchanges: [{"eid":"Futures_Binance","currency":"BTC_USDT"}]
*/

//@version=5
strategy("Simple MA AI Strategy + All Pattern Recognition (Reversed)", overlay=true, default_qty_type=strategy.percent_of_equity, default_qty_value=1, max_bars_back=500)

// === INPUTS ===- 1