
Overview
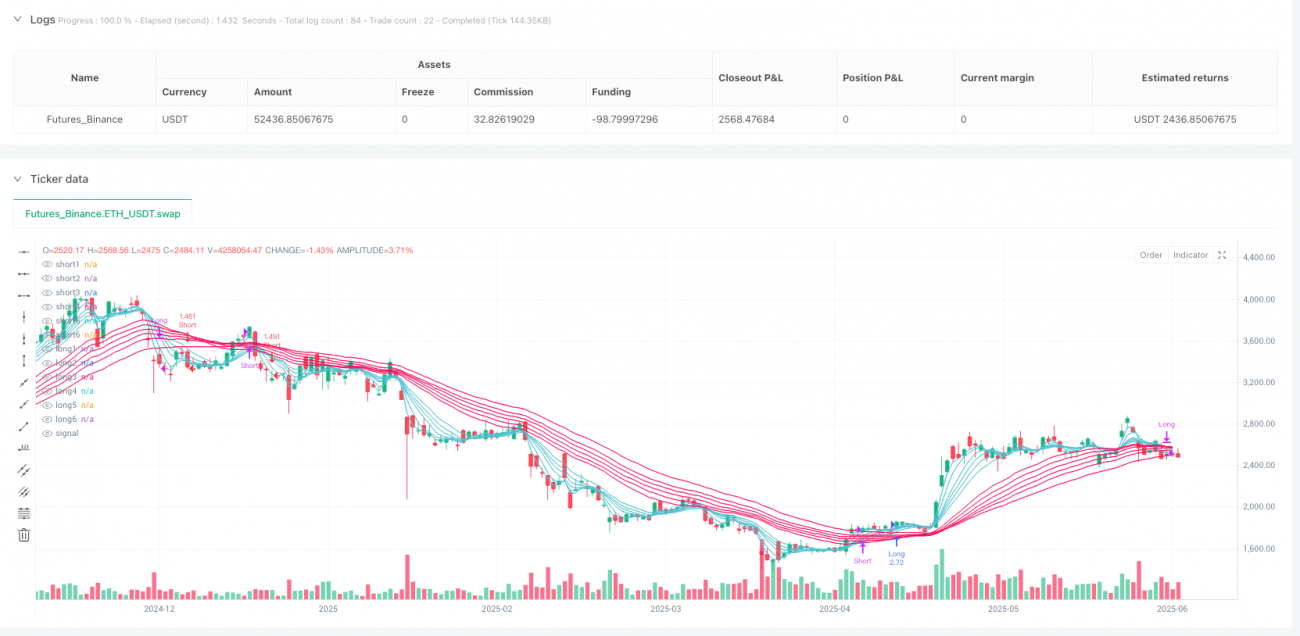
The Adaptive Weighted Moving Average Cross Stacking Strategy (AWMA Cross Stacking Strategy) is a trend-following system based on the cross-relationships and stacking patterns of multiple-period Weighted Moving Averages (WMAs). The strategy ingeniously combines 6 short-period WMAs and 6 long-period WMAs, determining market trend direction and strength by observing their crossovers and relative positions. The core design philosophy aims to capture strong trend momentum while providing rule-based clear exit signals to reduce losses during trend reversals.
Strategy Principle
The core principle of this strategy is built on hierarchical analysis of weighted moving averages and multiple confirmation mechanisms:
-
Multi-period WMA Calculation:
- Short-period group: Calculates 6 different period WMAs (3, 5, 8, 10, 12, 15)
- Long-period group: Calculates 6 different period WMAs (30, 35, 40, 45, 50, 60)
-
Key Parameter Analysis:
- Short-period maximum (short_max): The highest value among all short-period WMAs
- Short-period minimum (short_min): The lowest value among all short-period WMAs
- Long-period maximum (long_max): The highest value among all long-period WMAs
- Long-period minimum (long_min): The lowest value among all long-period WMAs
- Short-period average (avg_short): Arithmetic mean of all short-period WMAs
- Long-period average (avg_long): Arithmetic mean of all long-period WMAs
-
Entry Conditions:
- Long entry: When the short-period maximum crosses above the long-period minimum (bullCross), and at close, the short-period minimum remains above the long-period maximum (bullAlign), meaning all short-period WMAs are positioned above all long-period WMAs
- Short entry: When the short-period maximum crosses below the long-period minimum (bearCross), and at close, the short-period maximum remains below the long-period minimum (bearAlign), meaning all short-period WMAs are positioned below all long-period WMAs
-
Exit Conditions:
- Long exit: When the average of short-period WMAs crosses below the average of long-period WMAs
- Short exit: When the average of short-period WMAs crosses above the average of long-period WMAs
Through this "extreme value crossover + average value confirmation" approach, the strategy can both timely capture trend formation and provide smooth exit signals when trends weaken, reducing the interference of false signals.
Strategy Advantages
After a deep analysis of the strategy's code implementation, we can summarize the following significant advantages:
-
Multiple Confirmation Mechanism: The strategy requires both crossover signals and stacking confirmation to execute trades, greatly reducing the risk of false breakouts. Particularly, the stacking condition (bullAlign/bearAlign) requires all short-period indicators to be on the same side of all long-period indicators, which is a very strong trend confirmation.
-
High Adaptability: By using multiple WMAs with different periods, the strategy can adapt to various market environments and price fluctuations. The short-period group captures immediate momentum, while the long-period group confirms the overall trend direction.
-
Clear Entry and Exit Rules: The strategy provides objective entry and exit signals based on mathematical models, reducing the emotional interference caused by subjective judgment.
-
Asynchronous Exit Mechanism: Entry is based on extreme value crossover and stacking, while exit is based on average value crossover. This design allows the strategy to hold positions longer during strong trends and exit promptly when trends weaken.
-
Comprehensive Notification System: The strategy integrates a JSON-based alert mechanism that can connect to external bot systems for automated trading and remote monitoring.
-
Visual Support: The strategy plots all 12 WMA indicator lines on the chart, allowing traders to visually observe market structure and potential signals.
Strategy Risks
Despite its sophisticated design, the strategy still has some potential risks and challenges:
-
Parameter Sensitivity: The strategy uses 12 different WMA period parameters, and the choice of these parameters can significantly impact strategy performance. Different markets or timeframes may require different parameter combinations for optimal results.
-
Poor Performance in Oscillating Markets: As a trend-following strategy, it may generate frequent false signals and "whipsaw effects" in sideways or highly volatile oscillating markets, leading to consecutive losses.
-
Lag Issues: All moving average-based systems have a certain lag. Although shorter WMAs are used to reduce this problem, the strategy may still miss optimal entry or exit points in rapidly reversing markets.
-
Computational Complexity: The strategy requires calculating and comparing multiple moving averages, which may cause performance issues on some trading platforms, especially in low timeframes or high-frequency trading environments.
-
Signal Congestion: Under certain market conditions, short-term and long-term WMAs may frequently cross, resulting in too many trading signals, increasing trading costs, and potentially leading to overtrading.
Strategy Optimization Directions
Based on the above analysis, the strategy can be optimized in the following aspects:
-
Dynamic Parameter Adjustment:
- Introduce adaptive mechanisms to automatically adjust WMA period parameters based on market volatility
- Use market volatility indicators (such as ATR) to adjust the sensitivity of entries and exits
- Consider incorporating machine learning algorithms to optimize parameter selection
-
Market Environment Filtering:
- Add trend strength filters, such as the ADX indicator, to trade only in strong trend environments
- Add volatility filters to avoid trading in high-volatility or low-volatility environments
- Consider adding longer-period trend confirmation indicators, such as monthly or weekly trend directions
-
Risk Management Enhancement:
- Introduce dynamic position management, adjusting trade size based on trend strength and market volatility
- Add trailing stop mechanisms to protect existing profits
- Implement partial position building and closing strategies to reduce timing risk
-
Signal Quality Improvement:
- Introduce volume confirmation, executing trades only when supported by volume
- Consider price structure (such as higher highs/lower lows patterns) as additional confirmation
- Add indicator divergence/convergence analysis to look for early signals of changing trend strength
-
Backtesting and Optimization Framework:
- Develop a more comprehensive backtesting system to test strategy performance under different market conditions
- Implement a step-by-step optimization framework to periodically reassess and adjust strategy parameters
- Consider using genetic algorithms or Monte Carlo simulations in the optimization process
Summary
The Adaptive Weighted Moving Average Cross Stacking Strategy is a sophisticated trend-following system that identifies strong trends and provides clear trading signals through the crossover and stacking relationships of multiple WMAs. The core advantage of this strategy lies in its multiple confirmation mechanisms and asynchronous exit design, which can effectively capture sustainable trends and reduce false signal risks.
However, like any technical analysis strategy, it also faces challenges such as poor performance in oscillating markets and parameter sensitivity. The strategy performance can be further improved by introducing dynamic parameter adjustment, market environment filtering, and enhanced risk management mechanisms.
For traders, it's crucial to understand the principles and limitations of this strategy. It's recommended to conduct thorough backtesting and simulation trading before real-world application, and to adjust parameter settings according to specific trading instruments and market environments. Additionally, using this strategy as part of a broader trading system, combined with fundamental analysis and risk management principles, is key to achieving long-term stable trading results.
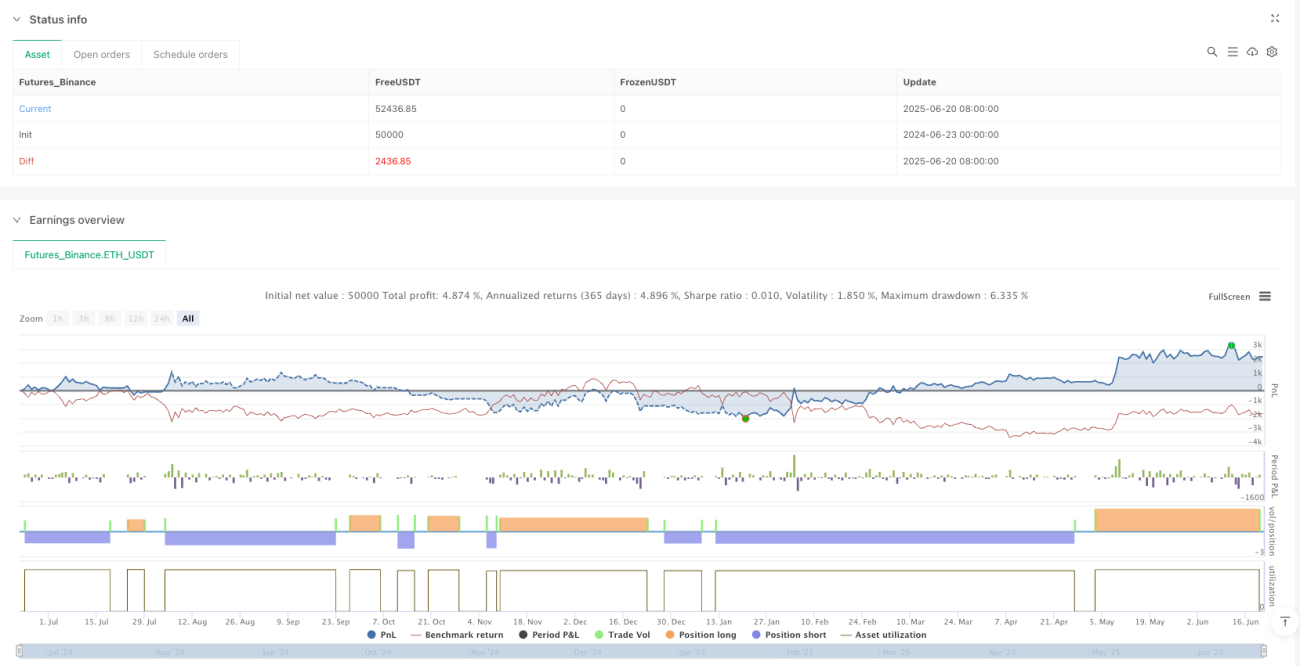
/*backtest
start: 2024-06-23 00:00:00
end: 2025-06-21 08:00:00
period: 1d
basePeriod: 1d
exchanges: [{"eid":"Futures_Binance","currency":"ETH_USDT"}]
*/

//@version=6
strategy("AWMA Strategy", overlay=true, default_qty_type=strategy.percent_of_equity, default_qty_value=10, calc_on_every_tick=true)

// Inputs- 1