
Overview
The Multi-Indicator Trend Confirmation and Reversal Quantitative Trading Strategy is a quantitative system that combines multiple technical indicators to identify high-probability trading opportunities. This strategy primarily uses RSI (Relative Strength Index) to determine overbought and oversold conditions, OBV (On-Balance Volume) to verify volume trend direction, EMA (Exponential Moving Average) to confirm overall market trend, and ADX (Average Directional Index) to filter out signals in low-volatility or sideways markets. The strategy has a clear design approach, implementing multiple indicator filters to achieve more precise trade signal selection, suitable for capturing reversal opportunities caused by overbought and oversold conditions in clearly trending markets.
Strategy Principles
The core principle of this strategy is to improve trading signal quality through multi-indicator collaborative filtering. Specifically:
-
RSI Application: RSI is used to identify overbought (>70) and oversold (<35) conditions. When RSI is below 35, it's considered oversold with potential for a rebound; when RSI is above 70, it's considered overbought with potential for a pullback.
-
OBV Momentum Confirmation: The strategy uses changes in OBV (On-Balance Volume) to confirm price momentum direction. Rising OBV indicates strengthening buying pressure, while declining OBV suggests selling pressure dominance.
-
EMA Trend Filtering: Exponential Moving Average serves as a trend direction filter. Price above the EMA indicates an uptrend, while price below suggests a downtrend. The strategy only enters positions when aligned with the overall trend direction.
-
ADX Volatility Filtering: ADX measures market trend strength. When the ADX value exceeds the user-defined threshold (default 45), it indicates the market is in a strong trend suitable for trading.
The strategy logic can be summarized as:
- Long entry conditions: RSI < 35 (oversold) + Rising OBV + Price above EMA (optional) + ADX > threshold
- Short entry conditions: RSI > 70 (overbought) + Falling OBV + Price below EMA (optional) + ADX > threshold
In the code implementation, the strategy provides four boolean input parameters (useRSI, useOBV, useEMA, useADX), allowing users to flexibly enable or disable any filter condition to adapt to different market environments or personal trading preferences.
Strategy Advantages
-
Multiple Confirmation Mechanism: By combining four technical indicators with different characteristics, the strategy provides multi-layered trade signal confirmation, significantly reducing the possibility of false signals.
-
Flexible Filtering System: Users can enable or disable any indicator filter condition based on market conditions and personal preferences, allowing for highly customized strategy implementation.
-
Avoids Sideways Market Trading: Through the ADX filter, the strategy effectively avoids generating signals in low-volatility sideways markets, which typically have more false breakouts and lower trading success rates.
-
Focus on High-Quality Reversals: The strategy focuses on capturing reversals caused by overbought and oversold conditions with volume confirmation, which typically have higher success rates.
-
Visual Assistance: The strategy provides clear visual cues, including buy/sell arrows and indicators when ADX filter conditions are met, helping traders intuitively understand the signal generation process.
-
Integrated Risk Management: By setting position size as a percentage of account equity (default 10%), the strategy has built-in basic risk management mechanisms.
Strategy Risks
-
Indicator Parameter Sensitivity: The multiple indicators used in the strategy all depend on their period parameter settings (such as RSI length, EMA length, etc.). Different parameter settings may lead to drastically different trading results, requiring thorough backtesting and optimization.
-
Over-Filtering Risk: While multiple indicator filtering can improve signal quality, it may also lead to excessive filtering, missing some favorable trading opportunities, especially in rapidly changing markets.
-
ADX Threshold Setting Challenge: The default ADX threshold is set to 45, which is a relatively high value and may cause the strategy to miss good trading opportunities in medium-strength trends.
-
Lack of Stop-Loss Mechanism: The current strategy code does not include explicit stop-loss mechanisms, which may lead to significant losses if the market suddenly reverses.
-
Lagging Issues: All technical indicators have certain lagging characteristics, especially EMA and ADX, which may result in less than ideal entry or exit timing.
Solutions:
- Conduct comprehensive parameter optimization to find the best parameter combinations for specific markets and timeframes
- Consider adding appropriate stop-loss and take-profit strategies, such as trailing stops or ATR-based stops
- Dynamically adjust the ADX threshold based on different market conditions, or combine with other trend confirmation tools
- Consider adding partial position management strategies, reducing position size when uncertainty is high
Strategy Optimization Directions
-
Dynamic Parameter Adjustment: Implement automatic adjustment of RSI overbought/oversold thresholds and ADX thresholds based on market volatility (such as ATR), making the strategy more adaptable to different market environments.
-
Add Stop-Loss Mechanisms: Integrate ATR-based stop-loss strategies or trailing stops to limit maximum loss per trade and protect capital.
-
Time Filters: Add market session filtering to avoid specific low-liquidity or high-volatility periods, such as around market open and close.
-
Improve Entry Timing: The current strategy enters immediately when conditions are met. Consider waiting for confirmation candles or price patterns (such as engulfing patterns) before entering, further improving accuracy.
-
Optimize OBV Application: The strategy currently only uses single-period changes in OBV. Consider using OBV and price divergence to capture stronger reversal signals.
-
Increase Trading Frequency Optimization: Add shorter-period indicator filters, such as short-term moving average crossovers, to capture more trading opportunities while maintaining high-quality signals.
-
Capital Management Optimization: Implement dynamic position sizing based on volatility and current account performance, increasing positions under favorable market conditions and reducing risk exposure under unfavorable conditions.
Implementation of these optimization directions can make the strategy more robust, adaptable to a wider range of market conditions, and improve long-term profitability.
Summary
The Multi-Indicator Trend Confirmation and Reversal Quantitative Trading Strategy is a well-designed quantitative trading system that effectively identifies high-probability reversal trading opportunities through the synergistic effect of four indicators: RSI, OBV, EMA, and ADX. This strategy is particularly suitable for operation in markets with clear trends and can filter out low-quality signals in sideways markets.
The main advantages of the strategy lie in its flexible multi-filtering system and clear trading logic, allowing traders to adjust strategy implementation according to personal preferences and market conditions. However, the strategy also has risks such as high parameter sensitivity and lack of comprehensive stop-loss mechanisms, which traders need to handle carefully in practical applications.
By implementing the suggested optimization directions, such as dynamic parameter adjustment, improved stop-loss mechanisms, and capital management optimization, this strategy has the potential to become a more robust and comprehensive trading system. Overall, this is a quantitative strategy framework with solid foundations and clear logic, suitable as a basic tool for medium to long-term trend trading and as an important component of more complex trading systems.
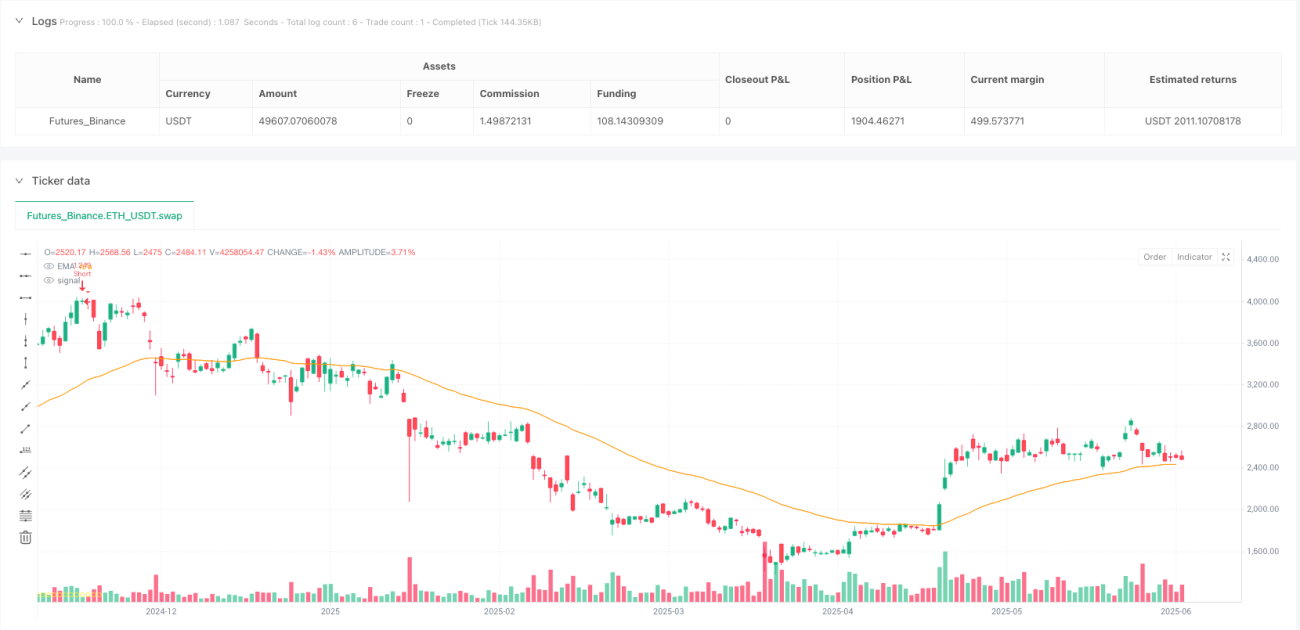
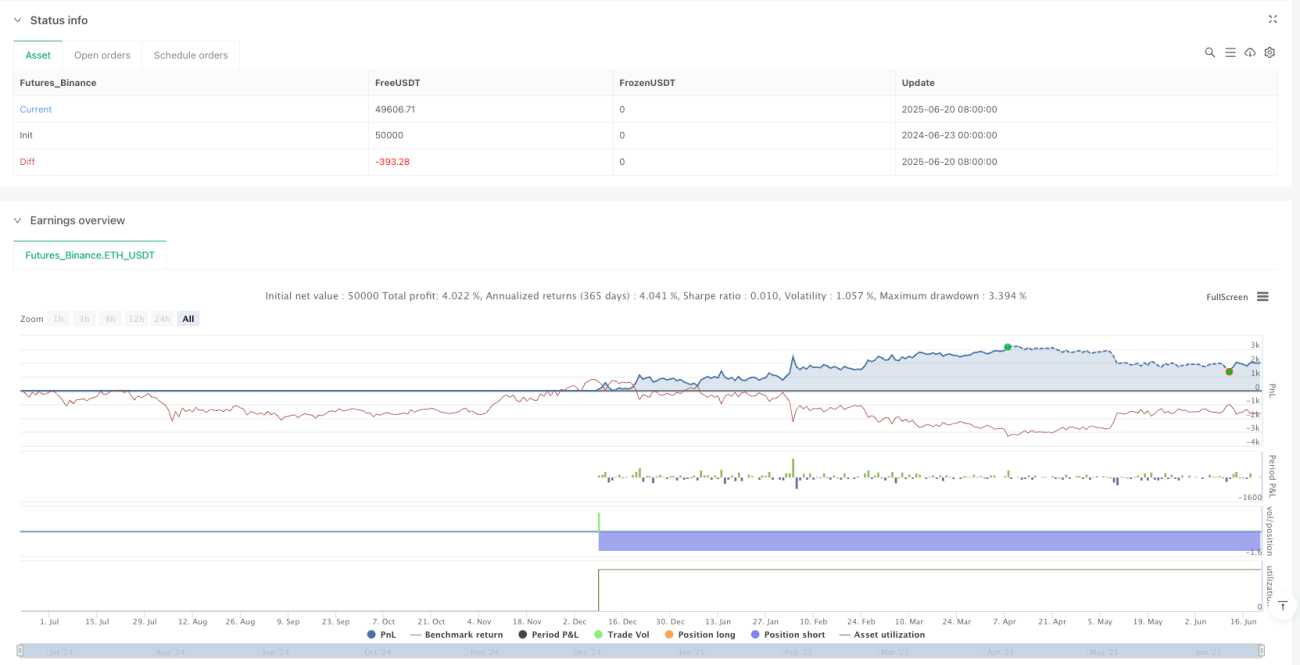
/*backtest
start: 2024-06-23 00:00:00
end: 2025-06-21 08:00:00
period: 1d
basePeriod: 1d
exchanges: [{"eid":"Futures_Binance","currency":"ETH_USDT"}]
*/

//@version=5
strategy("RSI + OBV + EMA + ADX Filter", overlay=true, default_qty_type=strategy.percent_of_equity, default_qty_value=10)

// === Inputs === //- 1