Volatility-Optimized RSI Mean Reversion Trading Strategy

RSI MA SMA MR RSI均值回归 波动率优化 趋势分析 止损策略 盈利目标 风险管理
Created on: 2025-06-23 10:40:11 Modified on: 2025-06-23 10:40:11
Copy: 0 Number of hits: 282
avatar of ianzeng123 ianzeng123
2
Follow
319
Followers

 Volatility-Optimized RSI Mean Reversion Trading Strategy  Volatility-Optimized RSI Mean Reversion Trading Strategy

Overview

The Volatility-Optimized RSI Mean Reversion Trading Strategy combines RSI (Relative Strength Index) mean reversion signals with intelligent market filtering and volatility-adapted risk management. This strategy primarily identifies high-probability reversal opportunities when RSI reaches extreme levels (RSI≤30 for oversold, RSI≥70 for overbought), but only trades when market conditions favor mean reversion strategies. Through in-depth code analysis, we can see that the core of this strategy lies in combining technical indicators with market state analysis to optimize trading decisions and maximize performance across different market conditions.

Strategy Principles

The principles of the Volatility-Optimized RSI Mean Reversion Trading Strategy are based on several key components:

  1. RSI Signal System: Uses a 14-period RSI indicator to identify market overbought and oversold conditions. When RSI falls below 30, the market is considered oversold, generating a buy signal; when RSI rises above 70, the market is considered overbought, generating a sell signal.

  2. Trend Analysis: The strategy uses a 50-period Simple Moving Average (SMA) to determine market direction. Price above the moving average indicates an uptrend, while price below the moving average indicates a downtrend. More importantly, the strategy calculates trend strength and avoids trading in strong trending markets (trend strength >25%) where mean reversion strategies typically perform poorly.

  3. Market Adaptability Analysis: The code calculates recent volatility to ensure the market is volatile enough (daily volatility >1%) to support a mean reversion strategy. It also checks if trend strength is within an acceptable range (≤25%). The strategy only considers entering trades when market conditions meet these criteria.

  4. Risk Management: The strategy implements a 20% stop loss to provide enough room for price movement in volatile assets, while setting a 20% profit target to ensure a 1:1 risk/reward ratio. It uses 5% of equity per trade and allows pyramiding of up to two positions to scale into strong setups.

  5. Signal Confirmation and Exit: Entry signals require RSI to reach extreme values and market conditions to be suitable. Exit conditions include RSI reversal (reaching the opposite extreme), stop loss trigger, or profit target achievement.

Strategy Advantages

Through in-depth analysis of the code, this strategy demonstrates the following significant advantages:

  1. Market Environment Adaptability: Unlike basic RSI strategies, this strategy filters trading signals through market state analysis, avoiding trades in market environments unsuitable for mean reversion strategies, significantly improving signal quality.

  2. Volatility-Adaptive Risk Management: The 20% stop loss level is designed for volatile assets, avoiding premature exits due to normal market fluctuations while providing adequate protection.

  3. Precise Entry Conditions: Combining RSI extremes, trend analysis, and volatility checks ensures entries only in high-probability setups, reducing false signals.

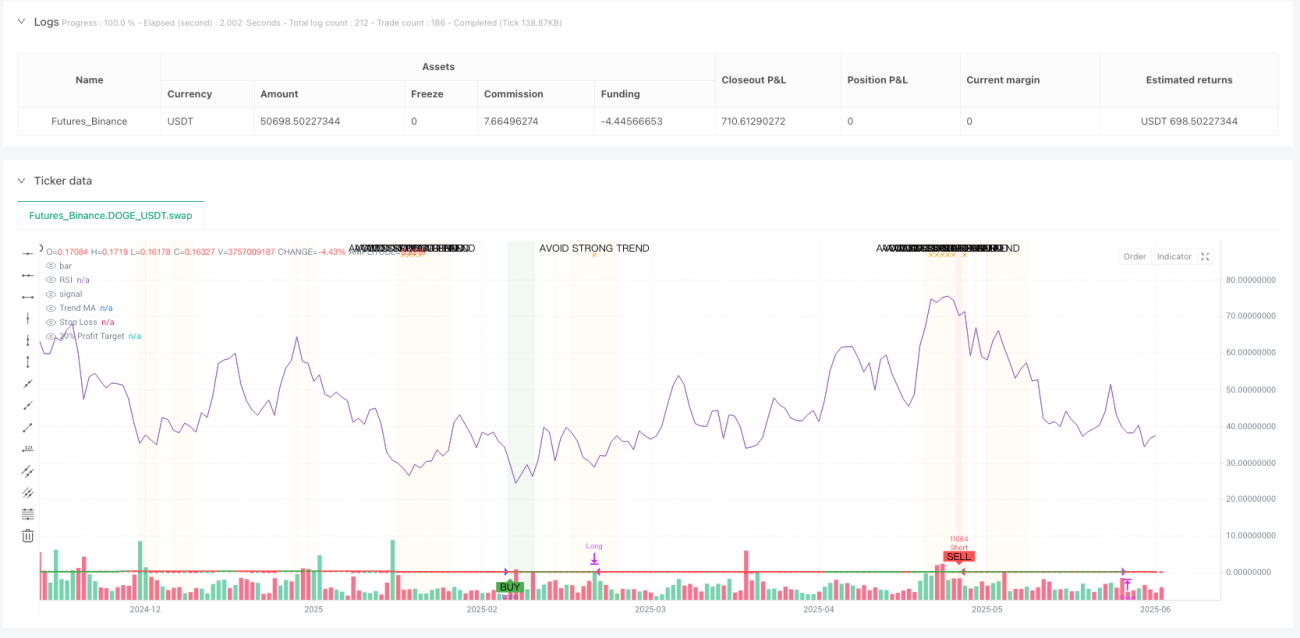
  4. Visual Decision Support: The strategy provides background color changes (green background for suitable buying zones, red background for suitable selling zones) and warning labels (orange warnings indicating strong trends to avoid trading), enhancing the intuitiveness of trading decisions.

  5. Automation-Friendly: Built-in complete alert condition system supports automated trade execution without manual market monitoring.

  6. Dynamic Information Table: Real-time display of market conditions and trade status, including current RSI values, trend strength, volatility, and market adaptability assessment, providing traders with a comprehensive market perspective.

Strategy Risks

Despite its well-designed nature, the strategy still presents some potential risks:

  1. Parameter Sensitivity: Strategy performance is highly dependent on input parameters such as RSI length, overbought/oversold levels, maximum trend strength, and volatility thresholds. Different market environments may require different parameter optimization, and incorrect parameters can lead to poor strategy performance.

  2. Extreme Market Conditions: During market crashes or periods of extreme volatility, even with a 20% stop loss, the strategy may face slippage risk, resulting in actual losses exceeding expectations.

  3. Capital Allocation Risk: The default use of 5% equity per trade and allowance for up to two positions (10% total) may be too aggressive for some traders, especially during high market volatility.

  4. Trend Judgment Lag: Using a 50-period moving average to judge trends may introduce lag, leading to incorrect judgments when trends have just changed.

  5. Over-Filtering Risk: Strict market adaptability checks (weak trend + sufficient volatility) may over-filter trading opportunities, resulting in too low trading frequency in certain market environments.

Solutions include: optimizing parameters for different markets and timeframes; pausing automated trading during extreme market conditions; adjusting capital allocation ratios based on personal risk tolerance; considering shorter-period moving averages to reduce trend judgment lag; appropriately relaxing market adaptability criteria to increase trading frequency.

Strategy Optimization Directions

Based on code analysis, the strategy can be optimized in the following directions:

  1. Dynamic Parameter Adjustment: Design RSI’s overbought/oversold thresholds as dynamic variables that automatically adjust based on historical volatility. Use narrower threshold ranges (e.g., 3565) in low-volatility environments and wider threshold ranges (e.g., 2575) in high-volatility environments. This will enable the strategy to better adapt to different market states.

  2. Multi-Timeframe Analysis: Add multi-timeframe confirmation mechanisms, such as confirming market state on longer timeframes and looking for entry signals on shorter timeframes. This approach can improve signal quality and reduce false breakouts.

  3. Dynamic Stop Loss Strategy: Set stop loss levels based on ATR (Average True Range) rather than fixed percentages. This will make stop loss points better adapt to current market volatility conditions, avoiding stops that are too close during high volatility periods or too far during low volatility periods.

  4. Partial Profit Mechanism: Implement a staged profit strategy instead of exiting the entire position at the 20% profit target. For example, exit 50% of the position at 10% profit and the remaining position at 20% profit. This can lock in partial profits while allowing the remaining position to potentially achieve greater returns.

  5. Seasonality and Market Cycle Analysis: Integrate market seasonality and cycle analysis, increasing trading frequency during periods when mean reversion strategies historically perform better, and decreasing trading frequency or adjusting parameters during stronger trending periods.

  6. Machine Learning Optimization: Use machine learning techniques to dynamically predict the probability of success for mean reversion strategies in the current market environment, and adjust entry criteria and position size accordingly. This will enable the strategy to more intelligently adapt to market changes.

Summary

The Volatility-Optimized RSI Mean Reversion Trading Strategy is a comprehensive and intelligent trading system that addresses the major drawbacks of basic RSI strategies by adding market context analysis and volatility-adaptive risk management, significantly improving strategy performance. This strategy is particularly suitable for assets with daily volatility above 1%, especially in ranging or weak trending markets.

The core advantage of the strategy lies in its intelligent market filtering mechanism, which only generates signals when market conditions are suitable for mean reversion trading, and protects capital through appropriate risk management measures. At the same time, the complete visualization system and information table provide a clear overview of market status, supporting more informed trading decisions.

Despite some risks and room for optimization, the basic design of the strategy is robust, and through the suggested optimization directions, its adaptability and performance across various market environments can be further improved. For traders seeking to capture mean reversion opportunities in volatile markets, this is a valuable strategy framework.

Strategy source code
/*backtest
start: 2024-06-23 00:00:00
end: 2025-06-21 08:00:00
period: 1d
basePeriod: 1d
exchanges: [{"eid":"Futures_Binance","currency":"DOGE_USDT"}]
*/

// This Pine Script™ code is subject to the terms of the Mozilla Public License 2.0 at https://mozilla.org/MPL/2.0/
// © cindycrijns

//@version=6 
strategy("RSI Mean Reversion", shorttitle="RSI_MR2", overlay=true, initial_capital=10000, default_qty_type=strategy.percent_of_equity, default_qty_value=5, pyramiding=2)

// Input parameters
rsiLength = input.int(14, "RSI Length")
rsiOversold = input.int(30, "RSI Oversold Level")
rsiOverbought = input.int(70, "RSI Overbought Level")
riskPercent = input.float(20.0, "Max Loss Per Trade (%)", minval=1.0, maxval=50.0)
profitTarget = input.float(20.0, "Profit Target (%)", minval=5.0, maxval=100.0)

// Trend analysis parameters
maLength = input.int(50, "Moving Average Length")
trendStrengthPeriod = input.int(20, "Trend Strength Period")
maxTrendStrength = input.float(25.0, "Max Trend Strength % (avoid above this)", minval=5.0, maxval=50.0)

// Calculate indicators
rsi = ta.rsi(close, rsiLength)
ma = ta.sma(close, maLength)

// Trend analysis
trendStrength = math.abs(close - close[trendStrengthPeriod]) / close[trendStrengthPeriod] * 100
isStrongTrend = trendStrength > maxTrendStrength
isUptrend = close > ma
isDowntrend = close < ma
isWeakTrend = trendStrength <= maxTrendStrength

// Market suitability check
priceAboveMA = close > ma
priceBelowMA = close < ma
recentVolatility = ta.stdev(ta.change(close), 20) / close * 100
isVolatileEnough = recentVolatility > 1.0  // At least 1% daily volatility

// Suitability for mean reversion strategy
isSuitableForStrategy = isWeakTrend and isVolatileEnough

// Enhanced RSI signals with trend filtering
longCondition = rsi <= rsiOversold and (isUptrend or isWeakTrend) and isSuitableForStrategy
shortCondition = rsi >= rsiOverbought and (isDowntrend or isWeakTrend) and isSuitableForStrategy

// Exit conditions
longExitCondition = rsi >= rsiOverbought
shortExitCondition = rsi <= rsiOversold

// Prevent overlapping trades
validLong = longCondition and strategy.position_size == 0
validShort = shortCondition and strategy.position_size == 0

// Strategy entries
if validLong
    strategy.entry("Long", strategy.long, comment="RSI Oversold Buy")
    
if validShort
    strategy.entry("Short", strategy.short, comment="RSI Overbought Sell")

// Risk management variables
var float entryPrice = na
var float stopLossPrice = na
var float profitTargetPrice = na

// Set levels when entering a trade
if strategy.position_size != 0 and na(entryPrice)
    entryPrice := strategy.position_avg_price
    stopLossPrice := strategy.position_size > 0 ? entryPrice * (1 - riskPercent/100) : entryPrice * (1 + riskPercent/100)
    profitTargetPrice := strategy.position_size > 0 ? entryPrice * (1 + profitTarget/100) : entryPrice * (1 - profitTarget/100)

// Stop Loss
if strategy.position_size > 0 and close <= stopLossPrice
    strategy.close("Long", comment="Stop Loss")
    entryPrice := na

if strategy.position_size < 0 and close >= stopLossPrice
    strategy.close("Short", comment="Stop Loss")
    entryPrice := na

// Profit Target - Close 100% at 20% profit
if strategy.position_size > 0 and close >= profitTargetPrice
    strategy.close("Long", comment="20% Profit Target")
    entryPrice := na

if strategy.position_size < 0 and close <= profitTargetPrice
    strategy.close("Short", comment="20% Profit Target")
    entryPrice := na

// Signal-based exits (RSI reversal)
if longExitCondition and strategy.position_size > 0
    strategy.close("Long", comment="RSI Exit")
    entryPrice := na

if shortExitCondition and strategy.position_size < 0
    strategy.close("Short", comment="RSI Exit")
    entryPrice := na

// Reset variables when position is closed
if strategy.position_size == 0
    entryPrice := na
    stopLossPrice := na
    profitTargetPrice := na

// Plot moving average and trend analysis
plot(ma, color=isUptrend ? color.green : color.red, linewidth=2, title="Trend MA")
plot(rsi, title="RSI", display=display.none)  // Hidden plot for alerts

// Plot signals
plotshape(validLong, style=shape.labelup, location=location.belowbar, color=color.green, text="BUY", title="Long Signal")
plotshape(validShort, style=shape.labeldown, location=location.abovebar, color=color.red, text="SELL", title="Short Signal")

// Plot risk management levels
plot(strategy.position_size != 0 ? stopLossPrice : na, color=color.red, linewidth=1, title="Stop Loss", style=plot.style_linebr)
plot(strategy.position_size != 0 ? profitTargetPrice : na, color=color.green, linewidth=1, title="20% Profit Target", style=plot.style_linebr)

// Background colors for market conditions
bgcolor(rsi <= rsiOversold and isSuitableForStrategy ? color.new(color.green, 90) : na, title="Good Buy Zone")
bgcolor(rsi >= rsiOverbought and isSuitableForStrategy ? color.new(color.red, 90) : na, title="Good Sell Zone")
bgcolor(isStrongTrend ? color.new(color.orange, 95) : na, title="Strong Trend - Avoid Trading")

// Warning labels for unsuitable conditions
plotshape(isStrongTrend and (rsi <= rsiOversold or rsi >= rsiOverbought), 
          style=shape.xcross, location=location.top, color=color.orange, 
          text="AVOID\nSTRONG TREND", title="Avoid Strong Trend Warning", size=size.small)

plotshape(not isVolatileEnough and (rsi <= rsiOversold or rsi >= rsiOverbought), 
          style=shape.diamond, location=location.top, color=color.gray, 
          text="LOW VOL", title="Low Volatility Warning", size=size.tiny)

// Enhanced info table with market analysis
if strategy.position_size != 0 or not isSuitableForStrategy
    var table infoTable = table.new(position.top_right, 2, 7, bgcolor=color.white, border_width=1)
    table.cell(infoTable, 0, 0, "Position", text_color=color.black, bgcolor=color.gray)
    table.cell(infoTable, 1, 0, strategy.position_size > 0 ? "LONG" : strategy.position_size < 0 ? "SHORT" : "NONE", text_color=color.black)
    table.cell(infoTable, 0, 1, "RSI", text_color=color.black, bgcolor=color.gray)
    table.cell(infoTable, 1, 1, str.tostring(rsi, "#.##"), text_color=color.black)
    table.cell(infoTable, 0, 2, "Trend Strength", text_color=color.black, bgcolor=color.gray)
    table.cell(infoTable, 1, 2, str.tostring(trendStrength, "#.##") + "%", 
               text_color=isStrongTrend ? color.red : color.green)
    table.cell(infoTable, 0, 3, "Volatility", text_color=color.black, bgcolor=color.gray)
    table.cell(infoTable, 1, 3, str.tostring(recentVolatility, "#.##") + "%", 
               text_color=isVolatileEnough ? color.green : color.red)
    table.cell(infoTable, 0, 4, "Market Status", text_color=color.black, bgcolor=color.gray)
    table.cell(infoTable, 1, 4, isSuitableForStrategy ? "GOOD FOR MR" : "AVOID TRADING", 
               text_color=isSuitableForStrategy ? color.green : color.red)
    table.cell(infoTable, 0, 5, "Target", text_color=color.black, bgcolor=color.gray)
    table.cell(infoTable, 1, 5, strategy.position_size != 0 ? str.tostring(profitTargetPrice, "#.###") : "N/A", text_color=color.green)
    table.cell(infoTable, 0, 6, "P&L", text_color=color.black, bgcolor=color.gray)
    table.cell(infoTable, 1, 6, strategy.position_size != 0 ? str.tostring(strategy.openprofit, "#.##") : "N/A", 
               text_color=strategy.openprofit >= 0 ? color.green : color.red)

// Alert conditions for automated trading
alertcondition(validLong, title="RSI Buy Signal", 
               message='BUY {{ticker}} at {{close}} - RSI: {{plot_0}} - Strategy: RSI_MR')

alertcondition(validShort, title="RSI Sell Signal", 
               message='SELL {{ticker}} at {{close}} - RSI: {{plot_0}} - Strategy: RSI_MR')

alertcondition(strategy.position_size > 0 and close >= profitTargetPrice, title="Long Profit Target", 
               message='CLOSE LONG {{ticker}} at {{close}} - Profit Target Hit')

alertcondition(strategy.position_size < 0 and close <= profitTargetPrice, title="Short Profit Target", 
               message='CLOSE SHORT {{ticker}} at {{close}} - Profit Target Hit')

alertcondition(strategy.position_size > 0 and close <= stopLossPrice, title="Long Stop Loss", 
               message='CLOSE LONG {{ticker}} at {{close}} - Stop Loss Hit')

alertcondition(strategy.position_size < 0 and close >= stopLossPrice, title="Short Stop Loss", 
               message='CLOSE SHORT {{ticker}} at {{close}} - Stop Loss Hit')