

Overview
The Dual Moving Average Crossover Trend-Following Strategy with MACD Confirmation Signal is a quantitative trading strategy that combines moving average crossovers with the MACD technical indicator. This strategy identifies trend changes using the crossover of short-term and long-term moving averages, while employing the MACD indicator to provide additional confirmation signals, thereby enhancing the accuracy of trading decisions. The strategy also integrates take-profit and stop-loss functions to effectively control risk. This combined approach aims to capture medium to long-term trend changes while filtering out false signals through indicator confirmation.
Strategy Principles
The core principles of this strategy are based on two key technical indicators: moving averages and the MACD indicator.
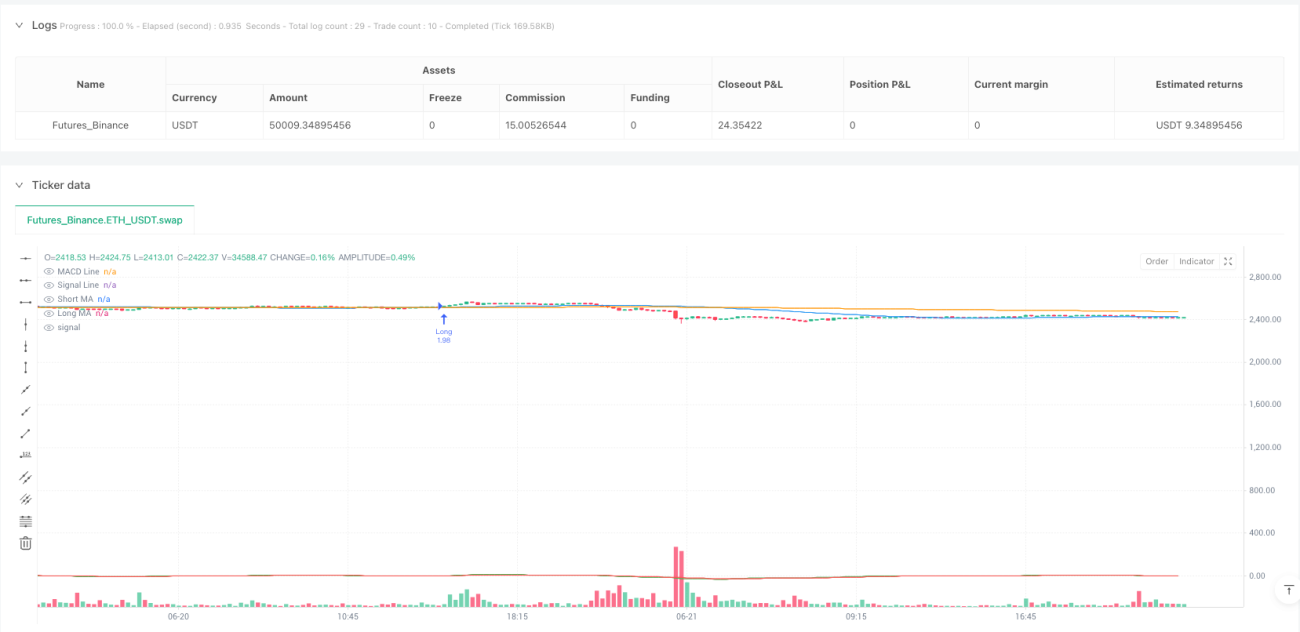
First, the strategy calculates two moving averages: a short-term moving average (default 50 periods) and a long-term moving average (default 200 periods). Users can choose between Simple Moving Averages (SMA) or Exponential Moving Averages (EMA) as the calculation basis. When the short-term moving average crosses above the long-term moving average, forming a "golden cross," this is typically viewed as the beginning of an uptrend.
Second, the strategy calculates the MACD indicator (default parameters 12, 26, 9) and uses the relative position of the MACD line to the signal line as trend confirmation. The uptrend is considered confirmed only when the MACD line is above the signal line.
The entry condition for the strategy is: the short-term moving average crosses above the long-term moving average (forming a golden cross) AND the MACD line is above the signal line. This combined condition requires both price trend and momentum indicators to simultaneously show bullish signals, thereby increasing the reliability of the signal.
The exit condition is: the short-term moving average crosses below the long-term moving average (forming a death cross), at which point the uptrend is considered to have ended.
Additionally, the strategy implements a percentage-based take-profit and stop-loss mechanism, with default settings of 5% for take-profit and 2% for stop-loss, providing a clear risk control range for each trade.
Strategy Advantages
-
Dual Confirmation of Trend and Momentum: By combining moving average crossovers and the MACD indicator, the strategy requires both price trend and momentum to show bullish signals simultaneously, effectively reducing the frequency of false signals.
-
Flexible Adjustable Parameters: The strategy allows for adjustment of short-term and long-term moving average periods, as well as the choice between SMA and EMA calculation methods, making the strategy adaptable to different markets and timeframes.
-
Comprehensive Risk Management: The built-in percentage-based take-profit and stop-loss mechanism can be adjusted according to market volatility and personal risk preferences, ensuring that the risk of each trade is maintained within a controllable range.
-
Systematic Trading Decisions: The strategy is entirely based on objective technical indicators, eliminating subjective emotional factors from the trading process and improving trading discipline.
-
Clear Strategy Logic: Despite combining multiple indicators, the strategy logic is clear, easy to understand and implement, making it suitable for traders of different experience levels.
Strategy Risks
-
Lag Risk: Moving averages are inherently lagging indicators, especially long-period moving averages (such as 200 periods), which may result in relatively delayed entry and exit signals, potentially failing to capture turning points in rapidly reversing markets.
-
Poor Performance in Ranging Markets: In ranging markets without clear trends, moving average crossover strategies tend to generate frequent false signals, leading to consecutive losing trades.
-
Parameter Sensitivity: Strategy performance is sensitive to parameter selection (such as moving average period lengths), and different markets and timeframes may require different parameter settings, necessitating thorough historical backtesting and optimization.
-
Over-reliance on Technical Indicators: The strategy is entirely based on technical indicators, ignoring fundamental factors and market structure changes, which may result in poor performance during major market events or abnormal market conditions.
-
Stop-Loss Risk: Fixed percentage stop-losses may be too tight in highly volatile markets, leading to frequent triggering, while being too loose in low-volatility markets, failing to effectively control risk.
Solutions:
- Consider introducing volatility-adaptive stop-loss settings
- Add market environment filtering conditions, such as using the ADX indicator to determine trend strength
- Optimize moving average parameters, or consider using adaptive moving averages
- Add trading filter rules to avoid frequent trading in ranging markets
Strategy Optimization Directions
-
Add Market Environment Filtering:
Introduce indicators such as ADX (Average Directional Index) or ATR (Average True Range) to assess market trend strength and volatility, executing trades only in strong trend market environments. This can significantly reduce false signals in ranging markets and improve the overall win rate of the strategy. -
Optimize Take-Profit and Stop-Loss Mechanisms:
Replace fixed percentage take-profit and stop-loss with dynamic mechanisms based on market volatility, such as using multiples of ATR to set stop-loss positions. This allows risk management to better adapt to current market conditions, setting wider stops in high-volatility markets and tighter stops in low-volatility markets. -
Add Trade Confirmation Filters:
In addition to MACD, consider adding RSI (Relative Strength Index) or Stochastic indicators as additional trade confirmation conditions, requiring consistent signals from multiple indicators before executing trades, further reducing the false signal rate. -
Introduce Time Filtering:
Consider market seasonality and time patterns, avoiding trading during historically poor-performing time periods, or using different parameter settings for different time periods. -
Explore Adaptive Parameters:
Replace fixed moving average periods and MACD parameters with adaptive parameters that automatically adjust based on recent market volatility or cyclicity, allowing the strategy to better adapt to constantly changing market environments. -
Add Position Management Module:
Currently, the strategy uses a fixed capital proportion (100% position size). Consider dynamically adjusting position size based on market trend strength, trade signal quality, or account profit/loss status to achieve more refined capital management.
Summary
The Dual Moving Average Crossover Trend-Following Strategy with MACD Confirmation Signal is a quantitative trading system that combines price trend and momentum indicators. By requiring the dual condition of the short-term moving average crossing above the long-term moving average and the MACD line being above the signal line, the strategy effectively filters out some false signals, improving the accuracy of trading decisions. At the same time, the built-in take-profit and stop-loss mechanism provides safeguards for risk control.
This strategy is suitable for use in medium to long-term market environments with obvious trends and is a good choice for traders who want to systematically capture trend changes while controlling risk. However, the strategy may not perform well in ranging markets and carries certain lag risks.
Through optimization directions such as adding market environment filtering, optimizing take-profit and stop-loss mechanisms, introducing additional confirmation indicators, and exploring adaptive parameters, the strategy has the potential to further improve performance and adaptability. For practical application, it is recommended to conduct thorough historical backtesting and parameter optimization across different markets and timeframes to find the most suitable parameter combinations for specific trading environments.
/*backtest
start: 2025-05-23 00:00:00
end: 2025-06-22 00:00:00
period: 15m
basePeriod: 15m
exchanges: [{"eid":"Futures_Binance","currency":"ETH_USDT"}]
*/


//@version=5
strategy("Trend-Following MA Crossover with MACD Confirmation", overlay=true, default_qty_type=strategy.percent_of_equity, default_qty_value=10)
- 1