
Overview
The OBV Adaptive Channel Breakout Momentum Strategy is a quantitative trading system that leverages the On-Balance Volume (OBV) indicator combined with dynamic channel breakout principles. This strategy abandons the traditional approach of OBV and Simple Moving Average (SMA) crossovers, instead adopting a dynamic channel constructed from OBV's historical highs and lows as the trigger mechanism for trading signals. The core concept is based on momentum theory that "once a trend is established, it tends to continue," capturing significant OBV breakouts to identify potential trend changes and implement trend-following trades.
The strategy innovatively applies the ATR (Average True Range) channel concept—typically used for price analysis—to the OBV indicator, establishing a trading system based on volume energy breakouts that is particularly effective for capturing strong trending markets driven by capital flows.
Strategy Principles
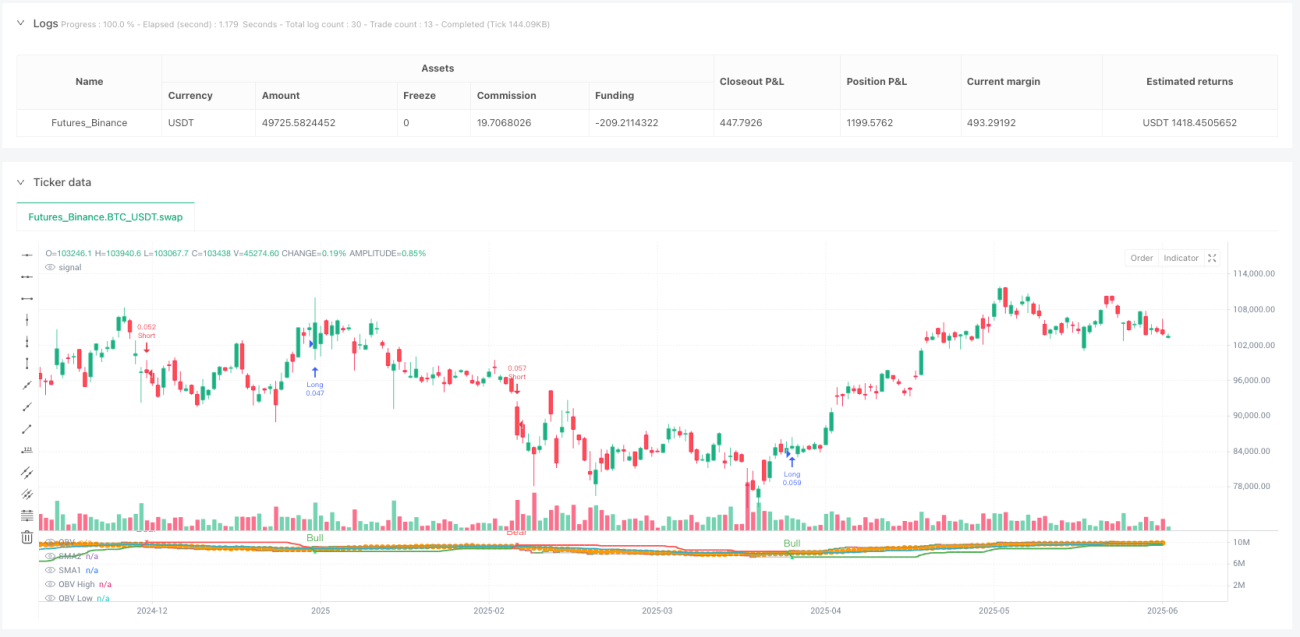
The operational mechanism of this strategy primarily revolves around the OBV indicator breaking through its own historically formed high and low channels:
-
OBV Indicator Calculation: The strategy first calculates the On-Balance Volume indicator, a cumulative indicator derived by adding daily volume multiplied by price direction (positive for up days, negative for down days).
-
Dynamic Channel Construction: The strategy uses an adjustable lookback period (default 30) to calculate the historical highest point (obv_high) and lowest point (obv_low) of the OBV indicator, forming a dynamically adjusting channel.
-
Mode Recognition Mechanism: The strategy introduces a "mode" variable to track the current market state:
- When OBV breaks above its historical high, it switches to "Bull Mode" (mode=1)
- When OBV breaks below its historical low, it switches to "Bear Mode" (mode=-1)
-
Dynamic Support/Resistance Line: Based on the current market mode, the strategy displays the corresponding dynamic support or resistance line:
- In Bull Mode, it displays the OBV's historical low as a dynamic support line (green)
- In Bear Mode, it displays the OBV's historical high as a dynamic resistance line (red)
-
Trading Signal Generation:
- Bull Signal (Long): Triggered when OBV first breaks above its historical high channel
- Bear Signal (Short): Triggered when OBV first breaks below its historical low channel
The core innovation of the strategy lies in its ability to not only identify OBV channel breakouts but also implement dynamic trend tracking through mode switching, allowing the support/resistance lines to automatically adjust with market conditions, thus providing more precise trading reference points.
Strategy Advantages
-
Capital Flow-Based Leading Indicator: As a measure of capital flow, OBV typically leads price movements, enabling earlier detection of market trend shifts and facilitating earlier entries.
-
Dynamic Adaptive Mechanism: Compared to traditional fixed-parameter moving average crossover strategies, this strategy's dynamic channel can adapt to changes in market volatility, maintaining effectiveness across different market environments.
-
Clear Visual Feedback: The strategy provides intuitive visual elements on the chart, including color-changing OBV lines, dynamic support/resistance lines, and clear buy/sell signal markers, making the decision-making process more intuitive.
-
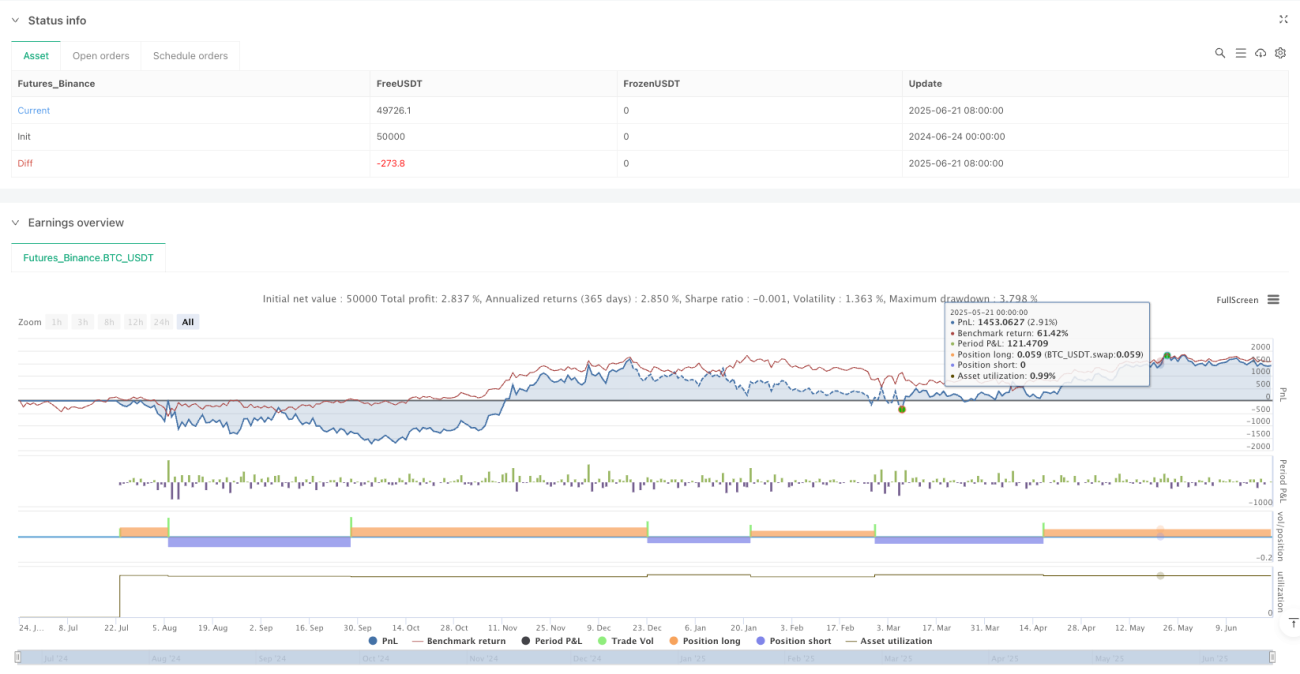
Integrated Backtesting Functionality: The strategy has been implemented as a complete TradingView Strategy rather than a simple Indicator, facilitating systematic historical backtesting and performance evaluation.
-
Reduced False Signals: By using a longer period (default 30) of historical highs and lows to construct the channel, the strategy effectively reduces false signals caused by short-term fluctuations, improving trading quality.
-
Dynamic Stop-Loss Reference: The dynamic support/resistance lines serve not only as trend confirmations but also as potential stop-loss reference points, aiding in systematic implementation of risk management.
Strategy Risks
-
Lag Risk: Although superior to traditional moving average crossovers, OBV channel breakouts still have some lag, which may lead to suboptimal entry points in volatile markets.
-
Parameter Sensitivity: The lookback period parameter significantly impacts strategy performance; different instruments and timeframes may require different parameter settings, and improper parameter optimization will affect strategy performance.
-
Lack of Profit-Taking Mechanism: The current strategy implementation lacks an explicit profit-taking mechanism, relying solely on reverse signals to exit, which may lead to profit giveback in strong trend markets.
-
Volume Quality Dependence: As an OBV-based strategy, its performance highly depends on the quality and reliability of volume data. In certain instruments or markets (such as cryptocurrency markets), volume data may be subject to manipulation or inaccuracies.
-
Trend Reversal Risk: The strategy is based on the assumption of trend continuation, but market trends can reverse at any time, especially at key support/resistance levels or during major news releases, potentially leading to false signals.
Risk mitigation methods:
- Combine with other technical indicators or price action analysis for trade confirmation
- Implement strict money management and position sizing
- Dynamically adjust the lookback period parameter based on different market conditions
- Add price action-based auxiliary exit conditions
Strategy Optimization Directions
-
Multiple Timeframe Analysis Integration: The current strategy operates only on a single timeframe. It can be enhanced by integrating multiple timeframe analysis to improve signal quality. For example, executing trades only when both larger timeframes and the current timeframe show signals in the same direction would help filter out false signals during counter-trend movements.
-
Intelligent Profit-Taking Mechanism: Dynamic take-profit points can be designed based on ATR or volatility percentages to lock in profits when the trend weakens but has not yet formed a reversal signal. For instance, when the price moves more than 2x ATR from the entry point, the stop-loss could be moved to breakeven.
-
Position Sizing Algorithm Optimization: Position size can be dynamically adjusted based on OBV breakout strength and market volatility, increasing positions on stronger breakout signals and reducing positions on weaker signals to optimize the risk-reward ratio.
-
Add Trend Strength Filter: Incorporate trend strength indicators (such as ADX) as signal filters, executing trades only when the trend is strong enough to avoid excessive false signals in ranging markets.
-
Lookback Period Adaptive Mechanism: Develop a mechanism that automatically adjusts the lookback period parameter based on current market volatility, allowing the strategy to maintain optimal performance across different market conditions without manual parameter adjustments.
-
Fundamental Trigger Integration: For markets with clear fundamental catalysts, consider adding fundamental event filters to pause trading before and after important economic data releases or company announcements, avoiding abnormal fluctuations caused by news factors.
These optimization directions are all based on the core principles of the strategy, aiming to enhance its effectiveness, robustness, and adaptability while maintaining its simplicity and understandability.
Conclusion
The OBV Adaptive Channel Breakout Momentum Strategy is an innovative quantitative trading system that effectively captures market trends by applying channel breakout concepts to the OBV indicator. Compared to traditional moving average crossover strategies, this strategy provides more precise trend transition signals and dynamic support/resistance references through dynamic channel construction and mode recognition mechanisms.
The core advantage of the strategy lies in its sensitivity to capital flows and adaptive mechanisms, enabling it to maintain good performance across different market environments. Additionally, the strategy's visualization design and integrated backtesting functionality provide traders with intuitive decision-making references and systematic performance evaluation tools.
However, like any strategy, it has limitations in terms of lag, parameter sensitivity, and dependence on volume data quality. Through implementing multiple timeframe analysis, intelligent profit-taking mechanisms, dynamic position sizing, and adaptive parameter adjustments, the overall performance and risk-reward characteristics of the strategy can be further enhanced.
Ultimately, this strategy provides a reliable framework for trend-following trading based on quantitative methods, particularly suitable for traders who wish to capture market trends based on capital flows rather than merely price movements.
/*backtest
start: 2024-06-24 00:00:00
end: 2025-06-22 08:00:00
period: 1d
basePeriod: 1d
exchanges: [{"eid":"Futures_Binance","currency":"BTC_USDT"}]
*/

//@version=5
// bas20230503 - Modified from the previous OBV+SMA version which was banned.
// This version replaces `indicator` with `strategy` for backtesting capability.
// Previously, the SMA crossover method was unreliable.- 1