Multi-Indicator Confluence Trading System

SMA MACD RSI BB EMA 动量指标 布林带 移动平均线 风险管理 止损策略
Created on: 2025-06-25 10:36:48 Modified on: 2025-06-25 10:36:48
Copy: 3 Number of hits: 334
avatar of ianzeng123 ianzeng123
2
Follow
319
Followers

 Multi-Indicator Confluence Trading System  Multi-Indicator Confluence Trading System

Overview

The Multi-Indicator Confluence Trading System is a quantitative trading strategy that combines multiple technical indicators to form trading decisions through comprehensive analysis of Moving Averages, RSI, MACD, and Bollinger Bands signals. The strategy’s distinctive feature is its “signal counting” approach, which requires multiple indicators to simultaneously emit signals in the same direction before executing a trade, thereby enhancing reliability. Additionally, the system integrates a risk management module that dynamically calculates position sizes based on stop-loss placement, effectively controlling risk exposure for each trade.

Strategy Principles

The core principle of this strategy is to confirm trading direction through the confluence of multiple indicator signals, comprising the following key components:

  1. Multi-Indicator Signal Generation:

    • Moving Average Crossover Signals: Determining trend direction through crossovers between short-term (20) and long-term (50) simple moving averages
    • RSI Overbought/Oversold Signals: Identifying market overbought (>70) and oversold (<30) conditions
    • MACD Crossover Signals: Confirming momentum direction through MACD line and signal line crossovers
    • Bollinger Band Touch Signals: Detecting potential reversal points when price touches the upper or lower bands
  2. Signal Counting Mechanism:

    • The strategy counts the number of bullish and bearish signals
    • A trade is only triggered when signals in a particular direction reach the preset threshold (default 2) and exceed the number of opposing signals
  3. Risk Management System:

    • Position Size Calculation Based on Risk Percentage: Dynamically calculating position size based on the predefined risk per trade (default 2%) and stop-loss distance
    • Maximum Position Limit: Setting an upper limit (default 10%) to prevent excessive leverage
    • Stop-Loss Strategy: Implementing percentage-based stop-loss levels (default 2%) for each trade
  4. Reversal Signal Exit Mechanism:

    • When signals opposite to the current position direction appear, the strategy automatically closes positions to secure profits or limit losses

Strategy Advantages

Through in-depth code analysis, this strategy demonstrates the following significant advantages:

  1. Multi-dimensional Signal Confirmation: By requiring multiple technical indicators to simultaneously emit signals in the same direction, the strategy effectively reduces the risk of false breakouts and erroneous signals, improving trading accuracy and reliability.

  2. Adaptive Risk Management: The strategy employs a risk-based position sizing method, dynamically adjusting position size according to actual stop-loss distance, ensuring that risk exposure for each trade remains at the preset level, effectively protecting capital safety.

  3. Flexible Parameter Configuration: The strategy offers a rich set of adjustable parameters, including indicator periods, risk percentages, and minimum signal counts, allowing users to customize according to different market environments and personal risk preferences.

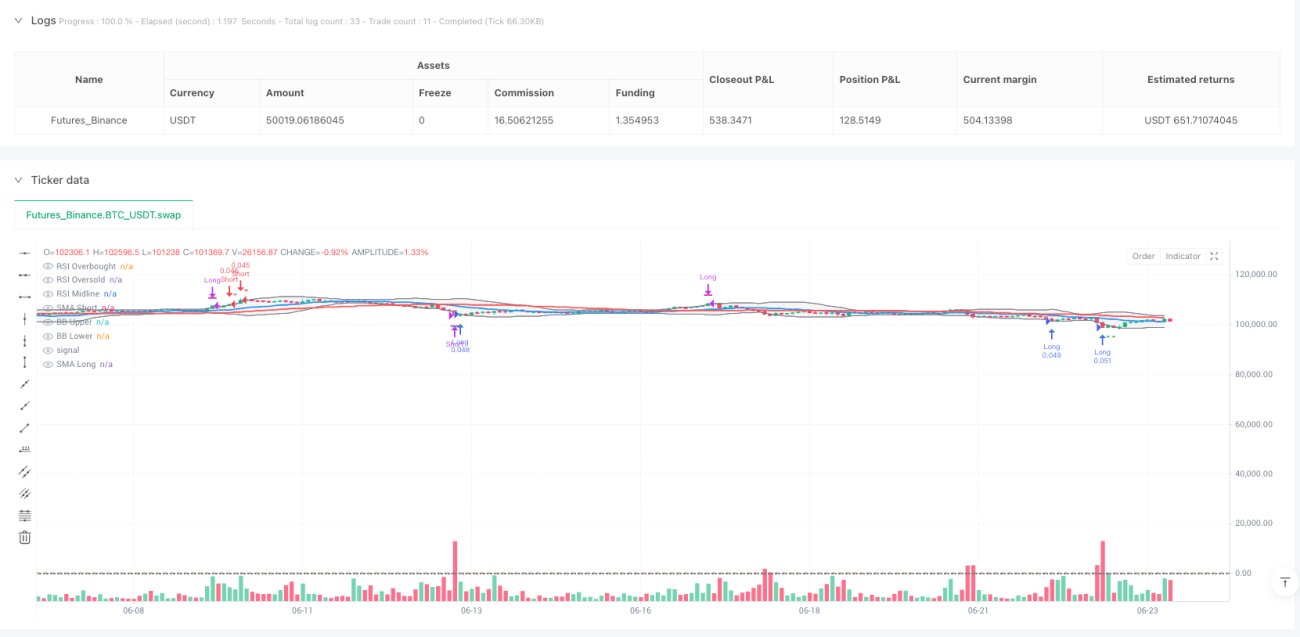
  4. Visual Signal Display: Through tabular format, the strategy intuitively displays the status of various indicator signals and overall signal strength, helping traders quickly assess current market conditions and potential trading opportunities.

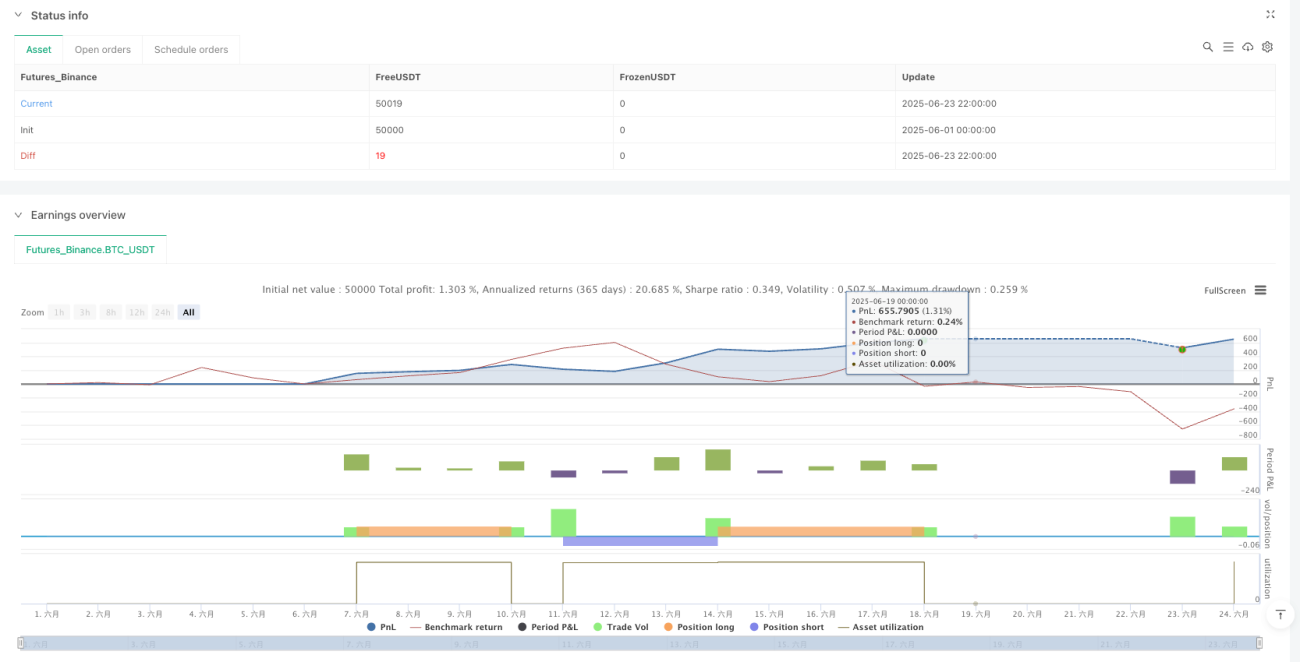
  5. Built-in Performance Monitoring: The strategy tracks key performance metrics in real-time, such as total trades, win rate, and maximum drawdown, facilitating continuous evaluation and optimization of strategy performance.

Strategy Risks

Despite its comprehensive design, the strategy still has the following potential risks and limitations:

  1. Overfitting Risk: The strategy utilizes multiple technical indicators, each with several adjustable parameters, which can easily lead to overfitting historical data and poor future performance. The solution is to conduct thorough backtesting and forward testing across different timeframes and market conditions.

  2. Signal Delay Issues: While the multi-indicator confirmation mechanism enhances reliability, it may also cause entry signal delays, missing ideal entry points. Consider introducing early warning indicators or adjusting the minimum signal count to balance accuracy and timeliness.

  3. Limited Adaptability in Ranging Markets: The strategy performs well in clearly trending markets but may generate frequent false signals and unnecessary trades in sideways or highly volatile market environments. It is advisable to add filtering conditions or temporarily reduce strategy sensitivity in ranging markets.

  4. Balance Between Complexity and Robustness: The complexity of multi-indicator strategies may affect their robustness and adaptability. In different market environments, some indicators may be more effective than others, necessitating a dynamic weighting mechanism.

  5. Fixed Stop-Loss Risk: Using fixed percentage stop-losses, while simple and intuitive, may not adapt well to changes in market volatility. Consider using ATR-based or volatility-based dynamic stop-losses to improve the adaptability of the stop-loss strategy.

Optimization Directions

Based on in-depth analysis of the strategy, here are several potential optimization directions:

  1. Dynamic Signal Weighting System: Weights can be assigned to each signal based on different market environments and historical accuracy of each indicator, rather than simple counting. For example, weights for Moving Averages and MACD might be increased in trending markets, while weights for RSI and Bollinger Bands might be increased in ranging markets, enhancing the strategy’s adaptive capability.

  2. Market Environment Classification: Introduce a market environment recognition module that classifies markets as trending, ranging, or transitional by analyzing volatility, volume, and price structure, adjusting strategy parameters and signal thresholds accordingly.

  3. Improved Stop-Loss Strategy: Replace fixed percentage stop-losses with dynamic stop-losses based on ATR or historical volatility to better adapt to actual market fluctuations. Also consider introducing trailing stop mechanisms to protect accumulated profits.

  4. Time Filtering: Implement trade time filtering mechanisms to avoid executing trades during high volatility periods such as market open, close, or important economic data releases, reducing slippage and execution risks.

  5. Integration of Machine Learning: Optimize indicator parameters and signal weights through machine learning algorithms to enhance the strategy’s adaptability and predictive accuracy. Algorithms such as Random Forest or Support Vector Machines can be used to predict the success probability of different signal combinations.

Conclusion

The Multi-Indicator Confluence Trading System is a comprehensively designed, logically clear quantitative trading strategy that enhances the reliability of trading decisions through integrated analysis and signal confluence of multidimensional technical indicators. The strategy also incorporates a risk-based position management system that effectively controls risk exposure for each trade, protecting trading capital.

While the strategy offers advantages such as multi-indicator confirmation, risk management, and flexible configuration, it also faces challenges including overfitting, signal delay, and market adaptability. By introducing dynamic signal weighting, market environment classification, improved stop-loss strategies, and machine learning integration, the strategy’s robustness and adaptability can be further enhanced.

Overall, this strategy provides traders with a reliable, flexible, and scalable framework suitable for those with experience in technical analysis and risk management. Through continuous monitoring and optimization, the strategy has the potential to maintain stable performance across different market environments.

Strategy source code
/*backtest
start: 2025-06-01 00:00:00
end: 2025-06-24 00:00:00
period: 2h
basePeriod: 2h
exchanges: [{"eid":"Futures_Binance","currency":"BTC_USDT"}]
*/

//@version=5
strategy(title="Multi-Indicator Trading Bot", overlay=true, default_qty_type=strategy.percent_of_equity, default_qty_value=10, initial_capital=10000, commission_type=strategy.commission.percent, commission_value=0.1)

// ===== INPUT PARAMETERS =====
// Risk Management
risk_per_trade = input.float(2.0, title="Risk Per Trade (%)", minval=0.1, maxval=10.0, step=0.1)
max_position_size = input.float(10.0, title="Max Position Size (%)", minval=1.0, maxval=50.0, step=1.0)
use_stop_loss = input.bool(true, title="Use Stop Loss")
stop_loss_pct = input.float(2.0, title="Stop Loss (%)", minval=0.5, maxval=10.0, step=0.1)

// Technical Indicator Parameters
sma_short = input.int(20, title="SMA Short Period", minval=5, maxval=50)
sma_long = input.int(50, title="SMA Long Period", minval=20, maxval=200)
rsi_period = input.int(14, title="RSI Period", minval=5, maxval=50)
rsi_oversold = input.int(30, title="RSI Oversold Level", minval=10, maxval=40)
rsi_overbought = input.int(70, title="RSI Overbought Level", minval=60, maxval=90)
macd_fast = input.int(12, title="MACD Fast Length", minval=5, maxval=20)
macd_slow = input.int(26, title="MACD Slow Length", minval=15, maxval=50)
macd_signal = input.int(9, title="MACD Signal Length", minval=5, maxval=20)
bb_length = input.int(20, title="Bollinger Bands Length", minval=10, maxval=50)
bb_mult = input.float(2.0, title="Bollinger Bands Multiplier", minval=1.0, maxval=3.0, step=0.1)

// Signal Threshold
min_signals = input.int(2, title="Minimum Signals Required", minval=1, maxval=4)

// ===== TECHNICAL INDICATORS =====
// Simple Moving Averages
sma_short_val = ta.sma(close, sma_short)
sma_long_val = ta.sma(close, sma_long)

// RSI
rsi_val = ta.rsi(close, rsi_period)

// MACD
[macd_line, signal_line, macd_hist] = ta.macd(close, macd_fast, macd_slow, macd_signal)

// Bollinger Bands
bb_basis = ta.sma(close, bb_length)
bb_dev = bb_mult * ta.stdev(close, bb_length)
bb_upper = bb_basis + bb_dev
bb_lower = bb_basis - bb_dev

// ===== SIGNAL GENERATION =====
// Moving Average Crossover Signals
ma_cross_up = ta.crossover(sma_short_val, sma_long_val)
ma_cross_down = ta.crossunder(sma_short_val, sma_long_val)

// RSI Signals
rsi_oversold_signal = rsi_val < rsi_oversold
rsi_overbought_signal = rsi_val > rsi_overbought

// MACD Signals
macd_bull_cross = ta.crossover(macd_line, signal_line)
macd_bear_cross = ta.crossunder(macd_line, signal_line)

// Bollinger Bands Signals
bb_lower_touch = close < bb_lower
bb_upper_touch = close > bb_upper

// ===== SIGNAL COUNTING =====
// Count bullish signals
bullish_signals = 0
bullish_signals := bullish_signals + (ma_cross_up ? 1 : 0)
bullish_signals := bullish_signals + (rsi_oversold_signal ? 1 : 0)
bullish_signals := bullish_signals + (macd_bull_cross ? 1 : 0)
bullish_signals := bullish_signals + (bb_lower_touch ? 1 : 0)

// Count bearish signals
bearish_signals = 0
bearish_signals := bearish_signals + (ma_cross_down ? 1 : 0)
bearish_signals := bearish_signals + (rsi_overbought_signal ? 1 : 0)
bearish_signals := bearish_signals + (macd_bear_cross ? 1 : 0)
bearish_signals := bearish_signals + (bb_upper_touch ? 1 : 0)

// ===== TRADING LOGIC =====
// Entry conditions
long_condition = bullish_signals >= min_signals and bullish_signals > bearish_signals
short_condition = bearish_signals >= min_signals and bearish_signals > bullish_signals

// Position size calculation based on risk
calculate_position_size() =>
    if use_stop_loss
        risk_amount = strategy.equity * (risk_per_trade / 100)
        stop_price = close * (1 - stop_loss_pct / 100)
        price_diff = close - stop_price
        position_value = risk_amount / (price_diff / close)
        max_value = strategy.equity * (max_position_size / 100)
        math.min(position_value, max_value)
    else
        strategy.equity * (max_position_size / 100)

// Calculate dynamic position size
position_size = calculate_position_size()
position_qty = position_size / close

// Entry orders
if long_condition and strategy.position_size == 0
    strategy.entry("Long", strategy.long, qty=position_qty)
    if use_stop_loss
        stop_price = close * (1 - stop_loss_pct / 100)
        strategy.exit("Stop Loss", "Long", stop=stop_price)

if short_condition and strategy.position_size == 0
    strategy.entry("Short", strategy.short, qty=position_qty)
    if use_stop_loss
        stop_price = close * (1 + stop_loss_pct / 100)
        strategy.exit("Stop Loss", "Short", stop=stop_price)

// Exit conditions (opposite signals)
if short_condition and strategy.position_size > 0
    strategy.close("Long", comment="Exit Long")

if long_condition and strategy.position_size < 0
    strategy.close("Short", comment="Exit Short")

// ===== PLOTTING =====
// Plot moving averages
plot(sma_short_val, color=color.blue, linewidth=2, title="SMA Short")
plot(sma_long_val, color=color.red, linewidth=2, title="SMA Long")

// Plot Bollinger Bands
p1 = plot(bb_upper, color=color.gray, linewidth=1, title="BB Upper")
p2 = plot(bb_lower, color=color.gray, linewidth=1, title="BB Lower")
fill(p1, p2, color=color.new(color.gray, 90), title="BB Background")

// Plot entry signals
plotshape(long_condition, style=shape.triangleup, location=location.belowbar, color=color.green, size=size.small, title="Long Signal")
plotshape(short_condition, style=shape.triangledown, location=location.abovebar, color=color.red, size=size.small, title="Short Signal")

// ===== INDICATOR SUBPLOT =====
// RSI
hline(rsi_overbought, "RSI Overbought", color=color.red, linestyle=hline.style_dashed)
hline(rsi_oversold, "RSI Oversold", color=color.green, linestyle=hline.style_dashed)
hline(50, "RSI Midline", color=color.gray, linestyle=hline.style_dotted)

// MACD (commented out to avoid overcrowding - uncomment if needed)
// plot(macd_line, color=color.blue, title="MACD Line")
// plot(signal_line, color=color.red, title="MACD Signal")
// plot(macd_hist, color=color.gray, style=plot.style_histogram, title="MACD Histogram")

// ===== SIGNAL STRENGTH INDICATOR =====
// Create a table to show signal strength
var table info_table = table.new(position.top_right, 3, 6, bgcolor=color.white, border_width=1)

if barstate.islast
    table.cell(info_table, 0, 0, "Signal Type", text_color=color.black, bgcolor=color.gray)
    table.cell(info_table, 1, 0, "Bullish", text_color=color.black, bgcolor=color.green)
    table.cell(info_table, 2, 0, "Bearish", text_color=color.black, bgcolor=color.red)
    
    table.cell(info_table, 0, 1, "MA Cross", text_color=color.black)
    table.cell(info_table, 1, 1, ma_cross_up ? "✓" : "", text_color=color.green)
    table.cell(info_table, 2, 1, ma_cross_down ? "✓" : "", text_color=color.red)
    
    table.cell(info_table, 0, 2, "RSI", text_color=color.black)
    table.cell(info_table, 1, 2, rsi_oversold_signal ? "✓" : "", text_color=color.green)
    table.cell(info_table, 2, 2, rsi_overbought_signal ? "✓" : "", text_color=color.red)
    
    table.cell(info_table, 0, 3, "MACD", text_color=color.black)
    table.cell(info_table, 1, 3, macd_bull_cross ? "✓" : "", text_color=color.green)
    table.cell(info_table, 2, 3, macd_bear_cross ? "✓" : "", text_color=color.red)
    
    table.cell(info_table, 0, 4, "Bollinger", text_color=color.black)
    table.cell(info_table, 1, 4, bb_lower_touch ? "✓" : "", text_color=color.green)
    table.cell(info_table, 2, 4, bb_upper_touch ? "✓" : "", text_color=color.red)
    
    table.cell(info_table, 0, 5, "Total Signals", text_color=color.black, bgcolor=color.yellow)
    table.cell(info_table, 1, 5, str.tostring(bullish_signals), text_color=color.green, bgcolor=color.yellow)
    table.cell(info_table, 2, 5, str.tostring(bearish_signals), text_color=color.red, bgcolor=color.yellow)

// ===== ALERTS =====
// Alert conditions
alertcondition(long_condition, title="Long Signal", message="Multi-Indicator Long Signal: {{ticker}} at {{close}}")
alertcondition(short_condition, title="Short Signal", message="Multi-Indicator Short Signal: {{ticker}} at {{close}}")
alertcondition(long_condition or short_condition, title="Any Signal", message="Multi-Indicator Signal: {{ticker}} at {{close}}")

// ===== PERFORMANCE METRICS =====
// Calculate additional metrics for display
var float max_drawdown = 0.0
var float peak_equity = strategy.initial_capital

if strategy.equity > peak_equity
    peak_equity := strategy.equity

current_drawdown = (peak_equity - strategy.equity) / peak_equity * 100
if current_drawdown > max_drawdown
    max_drawdown := current_drawdown