
Overview
The RSI and Stochastic RSI Divergence Trading Strategy is an advanced technical analysis approach designed to identify key reversal points in markets. This strategy combines the power of the Relative Strength Index (RSI) and Stochastic Relative Strength Index (SRSI) by monitoring divergences between price and these momentum indicators to predict potential trend changes. Additionally, the strategy incorporates an Exponential Moving Average (EMA) as a trend filter and applies precise swing distance filters to ensure it captures meaningful market structure changes rather than market noise.
Strategy Principles
The core principle of this strategy is based on the concept of divergence in technical analysis. Divergence occurs when price movement is inconsistent with technical indicator movement, typically suggesting that the current trend may be about to reverse. The strategy focuses on four types of divergences:
- Regular Bullish Divergence: When price makes a lower low, but RSI or SRSI fails to make a lower low. This indicates weakening downward momentum, potentially signaling the start of an uptrend.
- Regular Bearish Divergence: When price makes a higher high, but RSI or SRSI fails to make a higher high. This indicates weakening upward momentum, potentially signaling the start of a downtrend.
- Hidden Bullish Divergence: When price makes a higher low, but RSI or SRSI makes a lower low. This typically indicates a pullback in an uptrend, suggesting the main uptrend will continue.
- Hidden Bearish Divergence: When price makes a lower high, but RSI or SRSI makes a higher high. This typically indicates a rebound in a downtrend, suggesting the main downtrend will continue.
The strategy employs strict filtering conditions to ensure the quality of divergence signals:
- Uses a lookback period (default 40 periods) to find significant swing points
- Requires a minimum swing distance percentage (default 1.5%) to filter out minor fluctuations
- Requires a minimum price move percentage from the last swing (default 0.5%)
When a divergence is detected, the strategy plots labels and connecting lines on the chart, allowing traders to visually identify these key signals. And the strategy automatically generates long and short entry signals based on the divergence signals.
Strategy Advantages
- Multi-layered Confirmation: Combining RSI and Stochastic RSI provides dual confirmation, reducing the likelihood of false signals. When both indicators show divergence, the signal is more reliable.
- Comprehensive Divergence Detection: The strategy detects both regular divergences (suggesting trend reversals) and hidden divergences (suggesting trend continuations), providing traders with a complete market perspective.
- Visual Representation: By visually marking divergences on the chart with labels and connecting lines, the strategy makes it easier for traders to identify and understand signals.
- High Adaptability: The strategy parameters such as lookback period, minimum swing distance, and minimum price move are all adjustable, allowing traders to optimize the strategy for different market conditions and timeframes.
- Noise Reduction through Filters: By implementing minimum swing distance and price movement thresholds, the strategy effectively filters out market noise to focus on meaningful price structure changes.
- Trend Context: The incorporation of the 200-period EMA provides broader trend context, helping traders understand the divergence signals within the overall market trend.
Strategy Risks
- False Divergences: Even with filters, the market can still produce false divergence signals, especially in highly volatile or ranging markets. This can lead to incorrect trading decisions and potential losses.
- Time Lag: Divergence signals typically form after the price has already begun to reverse, which can lead to suboptimal entry points, especially in rapidly moving markets.
- Parameter Sensitivity: The strategy's performance is highly dependent on parameter settings such as lookback period and minimum swing distance. Inappropriate parameters can lead to too many or too few signals.
- Indicator Limitations: RSI and SRSI, as momentum indicators, may not be reliable in certain market conditions, particularly in prolonged trending markets or extremely volatile environments.
- Lack of Stop-Loss Mechanism: The current strategy implementation doesn't include explicit stop-loss strategies, which increases potential downside risk.
To mitigate these risks, it is recommended to:
- Combine divergence signals with other technical indicators or analysis methods, such as support/resistance levels, candlestick patterns, or volume analysis
- Test and optimize parameter settings in different market conditions
- Implement appropriate money management and stop-loss strategies
- Consider the significance of divergence signals in the context of the overall market trend
Strategy Optimization Directions
- Incorporate Stop-Loss and Take-Profit Mechanisms: The current strategy lacks risk management features. Adding dynamic stop-losses based on ATR (Average True Range) or fixed stop-losses based on key support/resistance levels can significantly improve the strategy's risk-reward ratio. Similarly, implementing take-profit rules based on price targets or time can help lock in profits.
- Add Trend Filters: While the strategy includes an EMA as a reference, it doesn't use it to filter trades. Adding conditions like only considering bullish divergences when price is above the 200-day EMA, or only considering bearish divergences when price is below the 200-day EMA, can help stay aligned with the major trend.
- Signal Confirmation Mechanisms: Introducing additional confirmation indicators, such as volume increase, candlestick confirmation patterns, or crosses of other momentum indicators, can improve signal reliability.
- Dynamic Parameter Adjustment: Implementing a mechanism to automatically adjust the lookback period and swing distance thresholds based on market volatility. For example, using larger thresholds in high-volatility markets and smaller thresholds in low-volatility markets.
- Divergence Strength Scoring: Developing a scoring system to evaluate the "strength" of a divergence based on the size of the deviation between price and indicator, the length of time over which the divergence formed, and other relevant factors. This can help traders prioritize stronger signals.
- Multi-Timeframe Analysis: Incorporating multi-timeframe confirmation, for example, only considering a signal when a higher timeframe also shows a divergence in the same direction, can reduce false signals.
- Improved Price Swing Detection: The current strategy uses simple high/low detection. Implementing more sophisticated price structure analysis (such as considering sequences of multiple swing points) can improve the accuracy of divergence detection.
- Market Environment Adaptation: Adding market environment classification functionality (such as trending, ranging, or high volatility) and adjusting strategy behavior based on the detected environment.
Summary
The RSI and Stochastic RSI Divergence Trading Strategy is a sophisticated and powerful technical analysis tool capable of capturing potential market reversals and trend continuation signals by identifying discrepancies between price and momentum indicators. By integrating both regular and hidden divergence detection and applying carefully designed filters, the strategy provides a comprehensive approach to identifying high-probability trading opportunities.
However, like all technical analysis methods, this strategy has limitations and risks. By implementing the suggested optimizations, such as adding risk management mechanisms, improving signal confirmation, and incorporating dynamic parameter adjustments, the strategy's robustness and performance can be significantly enhanced.
Ultimately, this strategy is best suited as part of a broader trading system, combined with other analytical tools and proper money management principles. For traders who understand technical analysis and market structure, this divergence strategy can be a valuable tool for discovering high-quality trade setups.
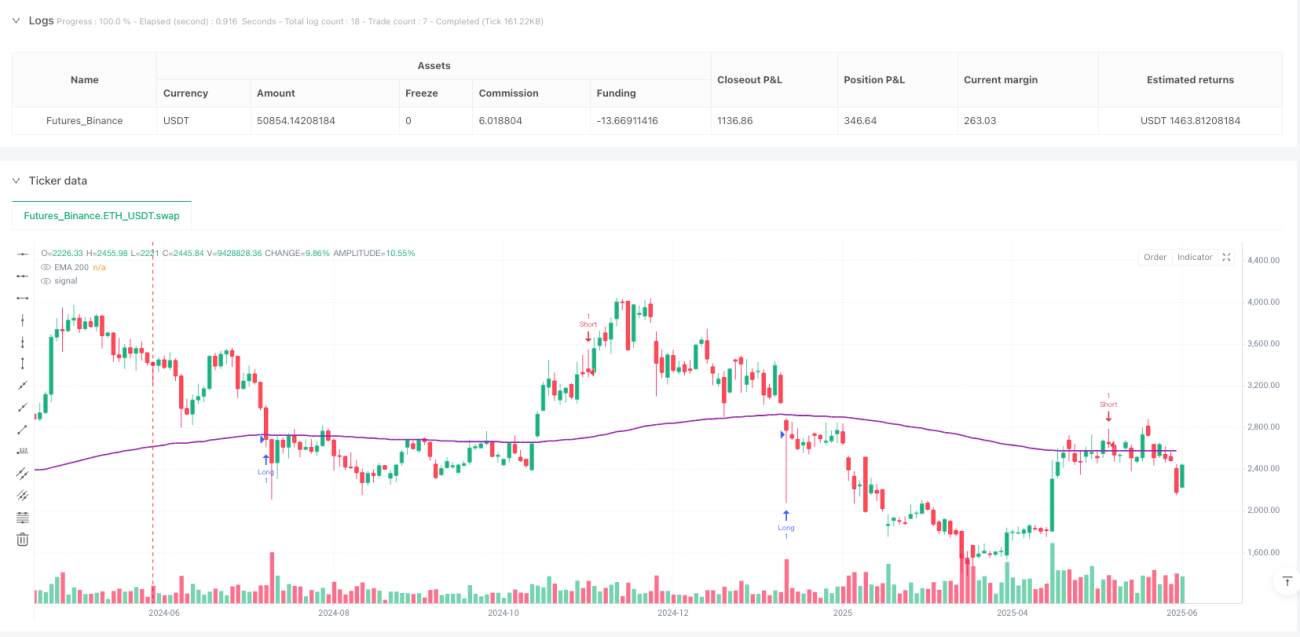
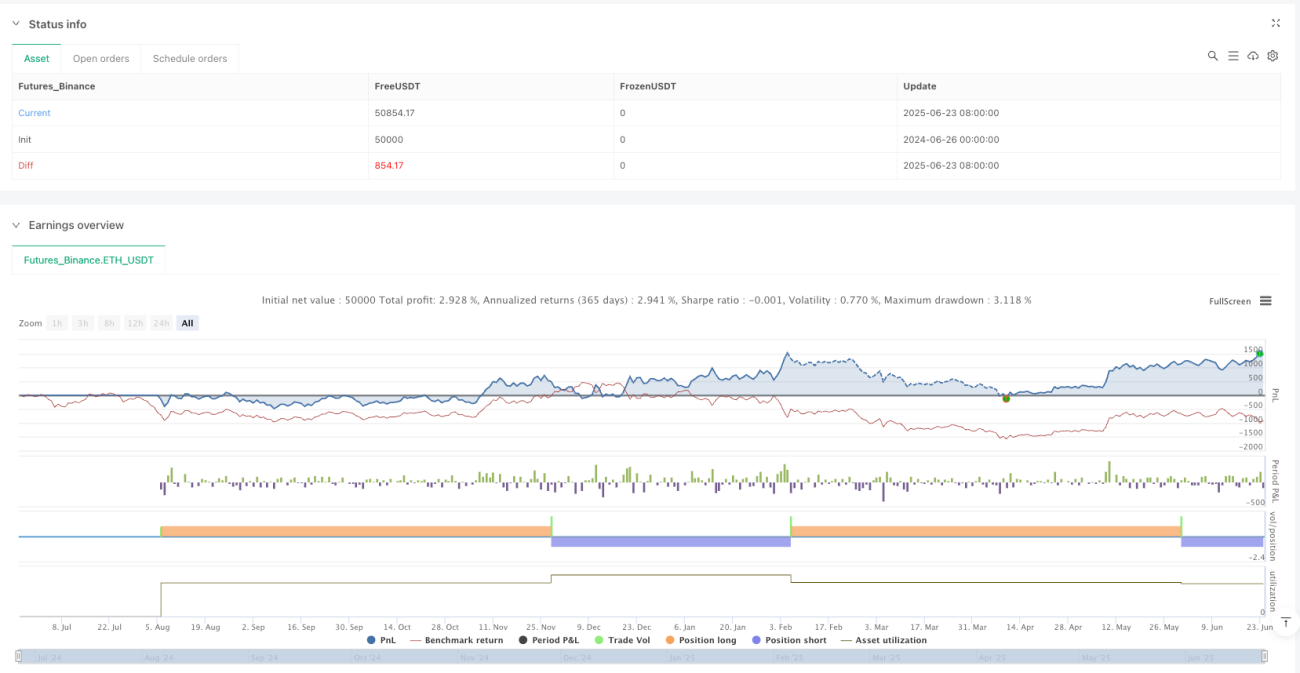
/*backtest
start: 2024-06-26 00:00:00
end: 2025-06-24 08:00:00
period: 2d
basePeriod: 2d
exchanges: [{"eid":"Futures_Binance","currency":"ETH_USDT"}]
*/

//@version=6
strategy("RSI Divergence Strategy", overlay=true)
//strategy("RSI & SRSI Divergence Strategy with EMA & Min Swing Filter + Price Chart Lines", overlay=true)
rsiLength = input.int(14, title="RSI Length")- 1