
Overview
This strategy is a quantitative trading approach that combines abnormal volume changes with price trends. It primarily identifies potential buy and sell signals by monitoring sudden increases or decreases in trading volume, coupled with price behavior and its relationship to the long-term moving average (SMA200). The strategy integrates volume-price relationship theory with trend-following methods, aiming to capture significant market turning points.
Strategy Principles
The core principle of this strategy is based on the collaborative analysis of volume changes and price movements, consisting of several key components:
-
Volume Analysis: The strategy calculates the average trading volume over the most recent 10 periods and uses this as a benchmark to identify abnormal volume. Specifically:
- One buy condition requires at least one instance within the last 10 periods where volume exceeds 150% of the average volume (volume surge)
- One sell condition requires at least one instance within the last 10 periods where volume falls below 50% of the average volume (significant volume contraction)
-
Price Action Analysis: The strategy determines price direction by examining the relationship between the current candle's opening and closing prices:
- Bullish candles (close higher than open) are used as one condition for buy signals
- Bearish candles (close lower than open) are used as one condition for sell signals
-
Long-term Trend Filter: The strategy employs a 200-period Simple Moving Average (SMA200) as a trend filter:
- Buy signals require price to be below SMA200, suggesting looking for rebound opportunities in a downtrend
- Sell signals require price to be above SMA200, suggesting looking for pullback opportunities in an uptrend
-
Signal Integration: Only when all the above conditions are simultaneously met will the final trading signal be triggered:
- Buy signal = Volume surge + Bullish candle + Price below SMA200
- Sell signal = Volume contraction + Bearish candle + Price above SMA200
-
Trade Execution: When a signal is triggered, the strategy first closes existing positions before opening new ones, avoiding simultaneous long and short positions.
Strategy Advantages
-
Integrated Volume-Price Analysis: This strategy not only focuses on price movements but also incorporates volume changes, providing a more comprehensive market perspective. Volume is often viewed as a confirming indicator for price movements; when price changes are supported by corresponding volume, the reliability of signals significantly increases.
-
Turning Point Capture: By identifying abnormal volume points and critical price trend reversals, the strategy can detect changes in market sentiment at an early stage, allowing for advance positioning.
-
Built-in Risk Management: By using SMA200 as a trend filter, the strategy avoids counter-trend trading in strong trend environments, reducing the risk of trading against the prevailing trend.
-
High Flexibility: The parameters in the strategy (such as average volume calculation period, SMA period, volume thresholds, etc.) can all be adjusted according to different markets and trading instruments, adapting to various market environments.
-
Automation Capability: The strategy integrates alert and trade execution functionalities, enabling fully automated operation and reducing emotional interference.
-
Zapier Integration: The strategy title mentions Zapier integration, indicating that it may have the capability to integrate with other applications (such as SMS notifications) through Zapier, enhancing its practicality and convenience.
Strategy Risks
-
False Signal Risk: Volume fluctuations don't always indicate genuine trend changes and may generate false signals. Especially in highly volatile markets, short-term volume fluctuations might lead to excessive trading signals.
-
Parameter Sensitivity: The strategy is sensitive to parameter settings, such as volume thresholds (1.5x and 0.5x) and moving average periods (10 and 200), which significantly impact strategy performance. Inappropriate parameters may result in overtrading or missing important signals.
-
Market Environment Dependency: Performance may vary greatly across different market environments (such as high-volatility or low-volatility markets). In certain market conditions, the relationship between volume and price may change.
-
Technical Limitations: The strategy primarily relies on technical indicators without considering fundamental factors, potentially underperforming during major fundamental events (such as earnings reports, policy changes, etc.).
-
Slippage and Trading Costs: In actual trading, slippage and trading costs can significantly impact the strategy's profitability, especially when the strategy generates frequent trading signals.
Strategy Optimization Directions
-
Optimize Parameter Settings: By backtesting different parameter combinations (such as different SMA periods, volume thresholds, etc.), find the most suitable parameter settings for specific markets or trading instruments. This can reduce false signals and improve strategy stability.
-
Add Additional Filtering Conditions: Consider adding other technical indicators as additional filters, such as Relative Strength Index (RSI), Stochastic Oscillator, or Bollinger Bands, to reduce the generation of false signals.
-
Dynamic Parameter Adjustment: Implement dynamic parameter adjustment to adapt to different market environments. For example, use stricter volume thresholds in high-volatility markets and relax thresholds in low-volatility markets.
-
Add Stop-Loss and Take-Profit Mechanisms: The current strategy lacks explicit stop-loss and take-profit mechanisms. Adding these mechanisms can help control single-trade risk and lock in profits.
-
Incorporate Multi-Timeframe Analysis: Improve signal reliability by analyzing data across multiple timeframes. For example, execute trades only when both short-term and medium-term timeframes show the same signal.
-
Enhance Zapier Integration: Further develop integration with Zapier to achieve more complex automated workflows, such as sending different notification content based on different types of signals, or integrating with other trading tools and platforms.
-
Add Volume Quality Analysis: In addition to considering volume size, analyze volume quality, such as large order ratio, bid-ask ratio, etc., to gain deeper insights into market sentiment.
Summary
This quantitative trading strategy based on abnormal volume and price trends provides a systematic framework for trading decisions by combining volume analysis, price action analysis, and trend filters. Its main advantage lies in considering both volume-price relationships and market trends, enabling it to capture potential market turning points.
However, the strategy also faces risks such as high parameter sensitivity and potential false signals. Through optimizing parameter settings, adding additional filtering conditions, incorporating stop-loss and take-profit mechanisms, etc., the stability and profitability of the strategy can be further improved.
For traders, understanding the principles and limitations of the strategy, making appropriate adjustments and optimizations based on their trading style and risk tolerance, is essential to maximize the strategy's value. Additionally, using this strategy as one of several reference tools for trading decisions, rather than the sole basis, is also a wise approach.
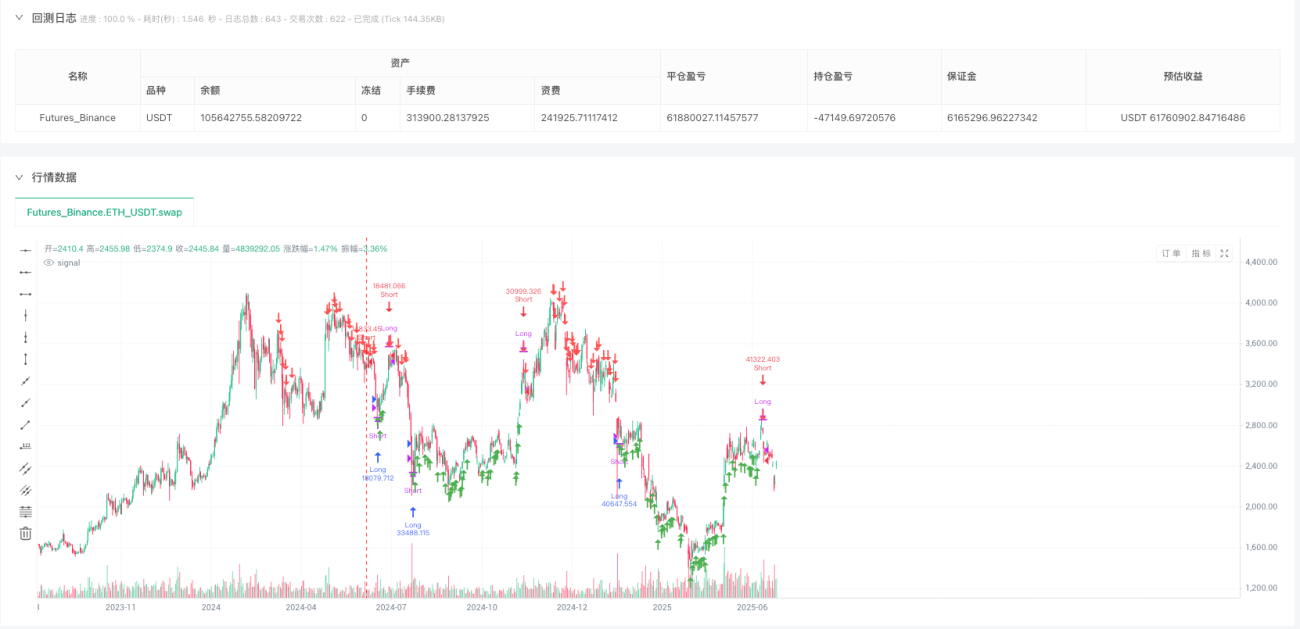
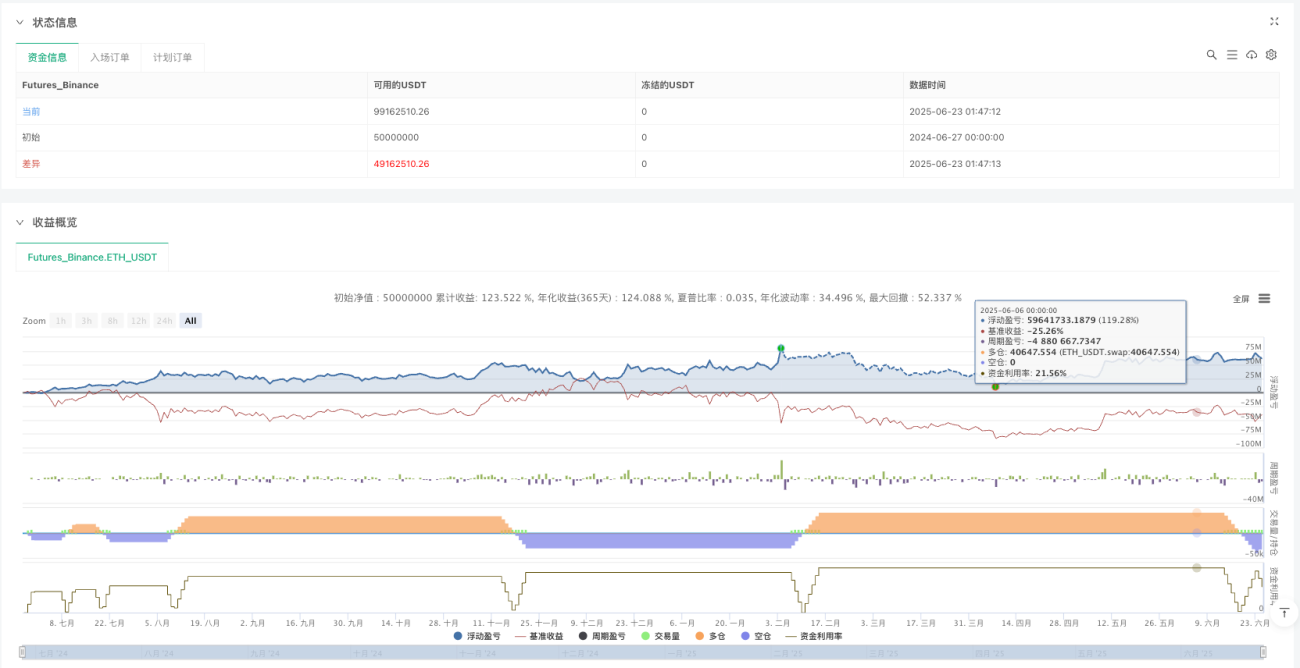
/*backtest
start: 2024-06-27 00:00:00
end: 2025-06-25 08:00:00
period: 1d
basePeriod: 1d
exchanges: [{"eid":"Futures_Binance","currency":"ETH_USDT","balance":50000000}]
*/

// This Pine Script® code is subject to the terms of the Mozilla Public License 2.0 at https://mozilla.org/MPL/2.0/
// © ACTION-TRADING
//@version=6
strategy("Stefan Whitwell Zapier Volume Indicator Test", overlay=true, default_qty_type=strategy.percent_of_equity, default_qty_value=100)- 1