Multi-Indicator Trend Confirmation Trading Strategy

Overview
The Multi-Indicator Trend Confirmation Trading Strategy is a comprehensive quantitative trading system that combines Stochastic RSI, Keltner Channels, Watson Envelope, Ichimoku Cloud, and higher timeframe trend confirmation analysis. This strategy aims to identify overbought and oversold market areas through the coordinated confirmation of multiple technical indicators while ensuring that the trading direction aligns with the main trend, thereby enhancing trading accuracy and reliability.
Strategy Principle
The core principle of this strategy is to implement a multi-layered filtering mechanism to ensure trades are only executed under high-probability market conditions. Specifically:
-
Stochastic RSI Indicator: First calculates the RSI (Relative Strength Index) value, then applies the stochastic formula to generate Stochastic RSI K-line and D-line. These indicators are used to identify overbought (>90) and oversold (<10) areas.
-
Keltner Channels: Constructs a price channel based on EMA (Exponential Moving Average) and ATR (Average True Range), helping to determine if the price is in extreme territory. The strategy requires the long signal price to be above the lower band, and short signal price to be below the upper band.
-
Watson Envelope: Creates price envelopes using a percentage offset based on a 20-period EMA. Similar to Keltner Channels, Watson Envelope provides additional price zone confirmation.
-
Ichimoku Cloud: Provides support for long-term trend analysis, including the Conversion Line (9-period), Base Line (26-period), Leading Span A (average of Conversion and Base Lines), and Leading Span B (average of 52-period high and low). The strategy requires long signal prices to be above Spans A and B, with short signals requiring the opposite.
-
Higher Timeframe Trend Confirmation: Uses a 30-minute (by default) timeframe EMA(50) to confirm the overall market trend direction, ensuring that the trading direction aligns with the larger market trend.
Long entry conditions require:
- Stochastic RSI K-line and D-line both below 10 (oversold)
- K-line crossing above D-line (momentum turning upward)
- Price above Watson Envelope lower band and Keltner Channel lower band
- Higher timeframe showing an uptrend
- Price above Ichimoku Cloud's Leading Spans A and B
Short entry conditions are the opposite, requiring Stochastic RSI overbought, K-line crossing below D-line, price below upper bands, higher timeframe showing a downtrend, and price below Ichimoku indicators.
Strategy Advantages
-
Multiple Confirmation Mechanisms: By integrating multiple different types of technical indicators, the risk of false signals is significantly reduced. Each indicator provides a unique market perspective, and when they collectively point to the same trading direction, the reliability of the signal is greatly enhanced.
-
Comprehensive Market Condition Analysis: The strategy simultaneously considers momentum (Stochastic RSI), volatility (Keltner Channels), trend (Ichimoku Cloud), and higher timeframe confirmation, providing a comprehensive analysis of the market.
-
Flexible Parameter Settings: The strategy allows users to adjust parameters for various indicators, including Stochastic RSI length, Keltner Channel multiplier, Watson Envelope offset, etc., making it adaptable to different market environments and trading instruments.
-
Trend Direction Filtering: Through higher timeframe analysis, the strategy ensures that the trading direction aligns with the primary market trend, avoiding the high risk of counter-trend trading.
-
Visualized Trading Signals: The strategy provides a clear graphical interface, including channel lines, signal markers, and indicator value visualization, allowing traders to intuitively understand and verify trading signals.
Strategy Risks
-
Parameter Sensitivity: The strategy relies on multiple technical indicators and their parameter settings. Different parameter combinations may lead to drastically different trading results. Over-optimization might lead to good backtest performance but poor real-trading performance.
-
Signal Lag: Due to the use of multiple moving averages and smoothing processes, the strategy may have a certain signal lag, especially in rapidly changing markets, potentially missing ideal entry points or resulting in late entries.
-
Over-Filtering Risk: While multiple condition confirmations improve signal quality, they may also cause missed profitable trading opportunities. In certain market environments, the strategy might not generate trading signals for extended periods.
-
Higher Timeframe Dependency: Reliance on higher timeframe trends may lead to poor trading performance in ranging markets or during the early stages of trend changes.
-
Lack of Stop-Loss Mechanism: There is no explicit stop-loss strategy in the code, which may result in excessive losses during adverse market movements.
To mitigate these risks, it is recommended to:
- Conduct thorough historical backtesting to find parameter combinations suitable for specific markets
- Add appropriate stop-loss and take-profit mechanisms
- Consider incorporating fundamental analysis and market sentiment indicators
- Regularly reassess and adjust strategy parameters to adapt to changing market conditions
Strategy Optimization Directions
-
Dynamic Parameter Adjustment: Implement parameter adaptive mechanisms based on market volatility or trend strength. For example, increase the Keltner Channel multiplier in high-volatility markets, or adjust Stochastic RSI thresholds in strong trend markets.
-
Improved Risk Management: Add stop-loss and take-profit mechanisms, such as ATR-based trailing stops or support/resistance-based take-profit settings. Consider implementing partial profit-taking mechanisms to lock in some gains.
-
Optimized Entry Timing: Incorporate price action analysis (such as candlestick patterns) or volume confirmation to further refine entry timing and reduce losses from false breakouts.
-
Additional Filtering Conditions: Consider adding market sentiment indicators or volatility filters to avoid trading under extreme market conditions. For example, pause trading when VIX or similar volatility indicators are extremely high.
-
Money Management Optimization: The strategy currently uses a fixed equity percentage (2%). Implement a dynamic money management system based on current position, market risk, or strategy performance.
-
Multi-Timeframe Analysis Extension: Besides the currently used 30-minute timeframe, add analyses from more timeframes to build a more comprehensive trend confirmation system.
-
Machine Learning Integration: Consider using machine learning techniques to optimize parameter selection or assign probability weights to trading signals, enhancing the strategy's adaptability and accuracy.
These optimization directions can not only improve the strategy's robustness and profitability but also enhance its adaptability in different market environments.
Summary
The Multi-Indicator Trend Confirmation Trading Strategy is a comprehensive quantitative trading system that builds a multi-level trading signal confirmation mechanism by integrating Stochastic RSI, Keltner Channels, Watson Envelope, Ichimoku Cloud, and higher timeframe analysis. The strategy's main advantages lie in its comprehensive market analysis and multiple signal confirmations, which help reduce false signals and improve trading accuracy.
However, the strategy also faces risks such as parameter sensitivity, signal lag, and over-filtering. By implementing dynamic parameter adjustments, improving risk management, optimizing entry timing, and extending multi-timeframe analysis, the strategy's robustness and profitability can be further enhanced.
Overall, this is a well-designed, logically clear quantitative trading strategy suitable for experienced traders to use based on a thorough understanding of its principles and risks. Through continuous monitoring, evaluation, and optimization, this strategy has the potential to achieve stable trading performance across various market environments.
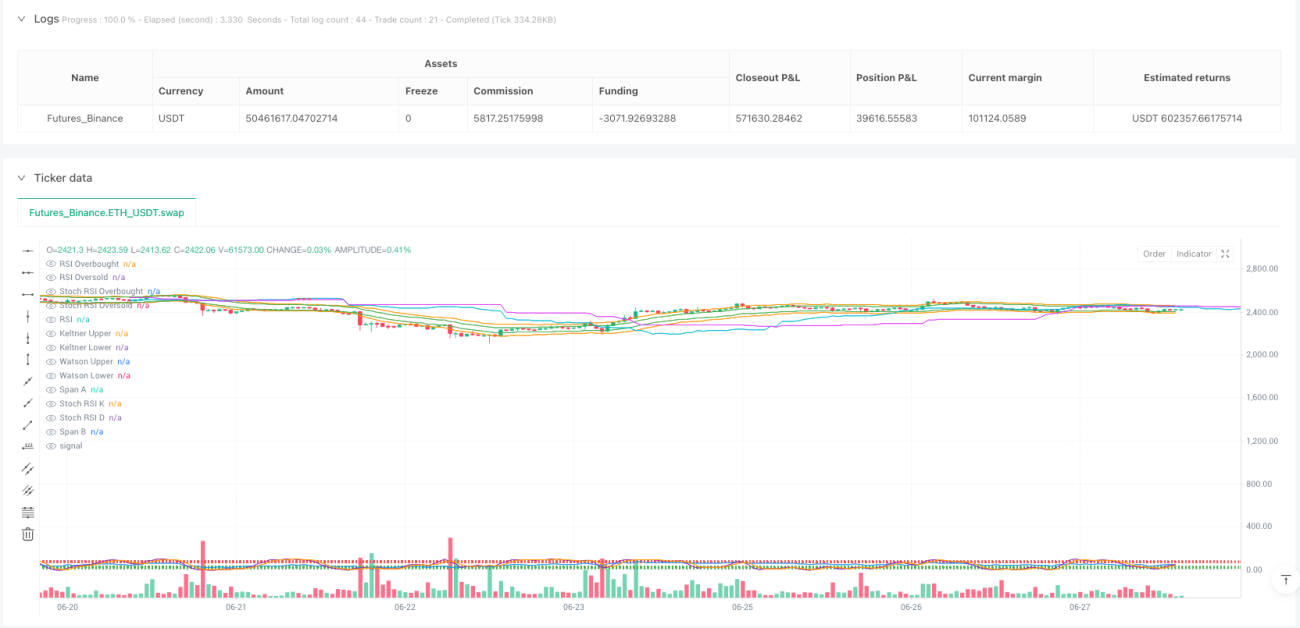
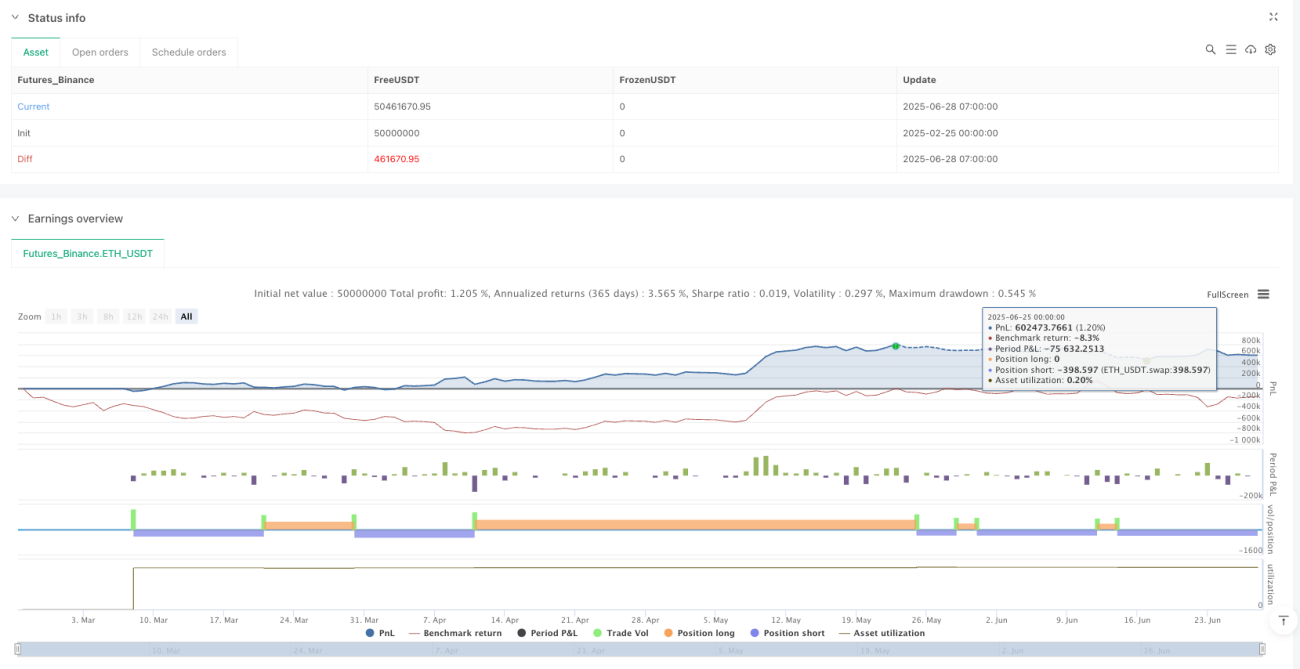
/*backtest
start: 2025-02-25 00:00:00
end: 2025-06-28 08:00:00
period: 1h
basePeriod: 1h
exchanges: [{"eid":"Futures_Binance","currency":"ETH_USDT","balance":50000000}]
*/

//@version=5
strategy("CNCRADIO talked GPT into Watching the YouTube!", overlay=true, default_qty_type=strategy.percent_of_equity, default_qty_value=2)

// === INPUTS ===- 1