
Overview
The HMA Acceleration Crossover Trading System is a comprehensive trend-following strategy that combines Hull Moving Average (HMA) crossover signals, Curvature momentum filter, and Average True Range (ATR) based risk management. This strategy determines market trend direction through crossovers of fast and slow HMAs, filters signals with sufficient momentum using the curvature indicator, and employs ATR to dynamically set stop-loss levels and position sizes, effectively adapting to market volatility. Supporting both long and short trading, the strategy aims to capture sustained trend movements while protecting capital through precise entry conditions and an adaptive risk control system.
Strategy Principles
The core principles of this strategy revolve around three key components:
-
HMA Crossover Signal System:
- Fast HMA (15-period) and Slow HMA (34-period) act as dynamic trend indicators
- A bullish crossover (fast HMA crosses above slow HMA) generates a long signal
- A bearish crossunder (fast HMA crosses below slow HMA) generates a short signal
- HMA responds faster than traditional moving averages, reducing lag
-
Curvature Momentum Filter:
- Curvature calculated as the second-order change rate of fast HMA: curv = ta.change(ta.change(fastHMA))
- This indicator essentially measures the "acceleration" of the trend
- Long requirement: curvature value greater than threshold (curvThresh), ensuring positive acceleration
- Short requirement: curvature value less than negative threshold (-curvThresh), ensuring negative acceleration
- This filtering mechanism effectively eliminates weak or stagnating market conditions lacking momentum
-
ATR-Based Risk Management Framework:
- Uses ATR (14-period) to measure market volatility
- Initial stop-loss distance = ATR × stop-loss multiplier (1.5)
- Trailing stop distance = ATR × trailing multiplier (1.0)
- Position calculation formula: Position = (Account Equity × Risk Percentage) ÷ Stop-Loss Distance
- This ensures that regardless of market volatility, the risk per trade always remains at a fixed percentage of account equity (default 1%)
The execution logic is clear: enter long when fast HMA crosses above slow HMA with positive curvature; enter short when fast HMA crosses below slow HMA with negative curvature. The exit strategy employs ATR-based trailing stops, adjusting the stop-loss level as price moves favorably to lock in profits. When trend conditions reverse (such as an opposing crossover signal), existing positions are closed.
Strategy Advantages
-
Strong Adaptability: HMA itself is sensitive to price changes, and the overall strategy automatically adjusts stop-loss distances and position sizes based on market volatility, maintaining relatively consistent performance across different market environments.
-
High-Quality Filtering: Through the application of the curvature indicator, the strategy can identify and filter out signals with insufficient momentum, only entering when trends have adequate acceleration, significantly reducing false breakouts and ineffective trades.
-
Strict Risk Control: The ATR-based risk management system ensures that the risk for each trade always remains at a preset level, preventing excessive losses from any single trade regardless of market volatility.
-
Dynamic Position Management: The strategy calculates optimal position sizes based on current market volatility and account equity, automatically reducing positions in high volatility and moderately increasing positions in low volatility, achieving a balance between capital efficiency and risk control.
-
Complete Trading Framework: The strategy provides a complete trading system from signal generation, entry conditions, and position calculation to stop-loss management, requiring no additional modules for practical application.
-
Bidirectional Trading Capability: Supports both long and short trading, seeking profit opportunities in various market trends without being limited to a single direction.
Strategy Risks
-
Poor Performance in Ranging Markets: As a trend-following strategy, it may generate consecutive small losses in sideways or frequently oscillating market environments, commonly known as "whipsaws." A solution is to add a market state identification module to pause trading or adjust parameters when ranging markets are detected.
-
Parameter Sensitivity: Strategy performance is relatively sensitive to parameter settings such as HMA periods, curvature threshold, and ATR multipliers. Improper parameter selection may lead to overtrading or missing important trends. It is recommended to optimize parameters through backtesting in different market environments or consider implementing parameter adaptation mechanisms.
-
Slippage and Liquidity Risk: In volatile markets, actual execution prices may significantly deviate from signal prices. Especially for less liquid instruments, this slippage can significantly impact strategy performance. Consider slippage factors in backtesting and choose sufficiently liquid trading instruments in live trading.
-
Systemic Risk Exposure: The strategy may hold larger positions in strong trend environments, and if the market experiences sudden reversals (such as major news impacts), trailing stops may not protect capital quickly enough. Consider setting absolute stop-loss limits or introducing volatility spike detection mechanisms as additional protection.
-
Overly Strict Curvature Filtering: Setting too high a curvature threshold may cause missing early trends, while setting it too low may introduce too many noise signals. Find a balance point in backtesting, or consider dynamically adjusting thresholds based on market conditions.
Optimization Directions
-
Multiple Timeframe Confirmation:
- Add longer-period HMA as a trend filter, only entering when long-term trend aligns with short-term signals
- Implementation: Add a long-period HMA indicator and use its direction as an additional entry condition
- Advantage: Significantly improves signal quality, reduces counter-trend trading
-
Adaptive Curvature Threshold:
- The current fixed curvature threshold may be too loose or too strict in different volatility environments
- Optimization: Dynamically adjust thresholds based on statistical distribution of historical curvature data
- Implementation: Use standard deviation or percentiles of curvature to set dynamic thresholds
- Advantage: Maintains optimal signal filtering effect across different market phases
-
Volume Confirmation Integration:
- The current strategy is based solely on price data, ignoring volume factors
- Optimization: Check for volume expansion when crossover signals are generated
- Implementation: Add volume indicators, requiring volume higher than n-day average during breakouts
- Advantage: Reduces false breakouts, improves signal reliability
-
Intelligent Stop-Loss Management:
- The current trailing stop mechanism is relatively simple and can be further optimized
- Optimization: Dynamically adjust stop-loss distances based on market structure
- Implementation: Tighten stops during trend acceleration phases, widen appropriately during consolidation
- Advantage: Better balance between profit protection and allowing price breathing room
-
HMA Difference Curvature Analysis:
- An interesting idea mentioned in code comments
- Optimization: Calculate curvature of the difference between the two HMAs, rather than analyzing fast HMA alone
- Implementation: diff = fastHMA - slowHMA; diffCurv = ta.change(ta.change(diff))
- Advantage: May provide more precise information about trend transition strength
-
Optimized Capital Management Strategy:
- The current fixed risk percentage may not be optimal
- Optimization: Dynamically adjust risk percentage based on system profit/loss status
- Implementation: Slightly increase risk percentage after consecutive wins, decrease after consecutive losses
- Advantage: Improves capital utilization efficiency in favorable market environments, better protects capital in unfavorable environments
Summary
The HMA Acceleration Crossover Trading System is a well-designed trend-following strategy that builds a complete and powerful trading framework by combining HMA crossovers, curvature momentum filtering, and ATR risk management. The core advantages of this strategy lie in its adaptability and comprehensive risk control, capable of capturing market trends while protecting trading capital.
The strategy is particularly suitable for markets with distinct trend characteristics but may face challenges in ranging markets. Through implementing the suggested optimization measures, especially multiple timeframe confirmation and adaptive parameter adjustment, strategy performance can be further enhanced. For quantitative traders, this is a system with solid foundations that can be applied directly or used as a starting point for building more complex trading strategies.
It is worth noting that any trading strategy requires thorough historical backtesting and simulated trading verification, with parameter adjustments based on specific market characteristics and personal risk preferences. This strategy provides a framework balancing technical analysis, momentum theory, and risk management, but successful application still requires careful adjustment and continuous monitoring by the trader.
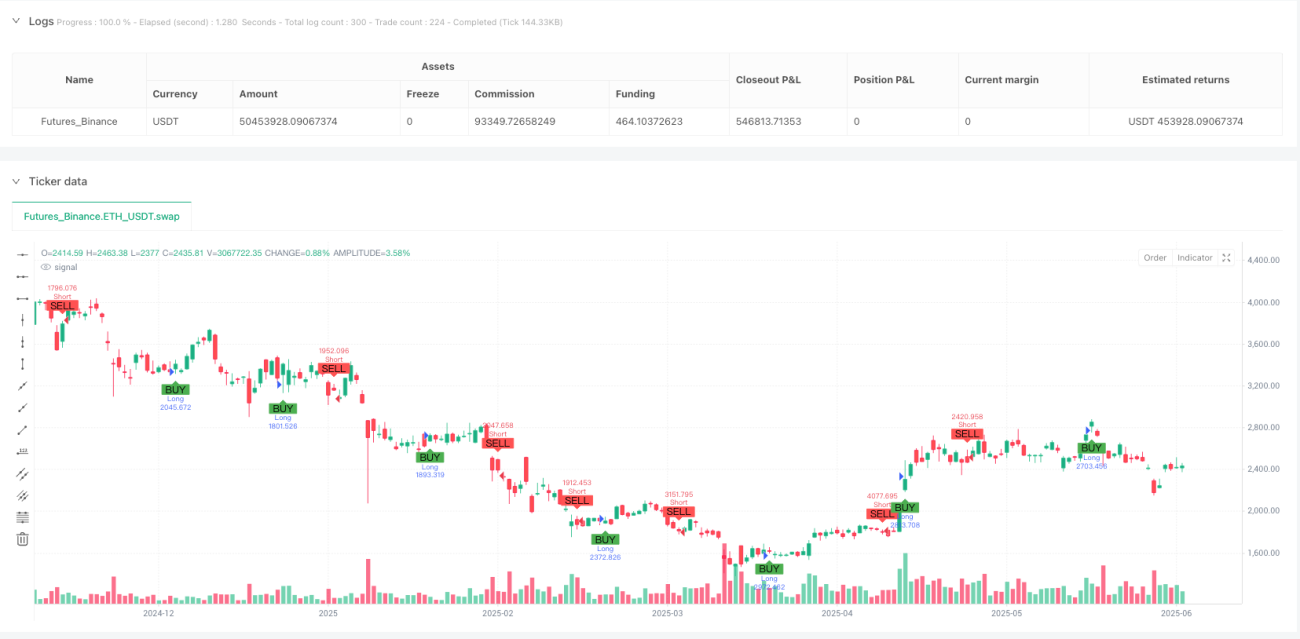
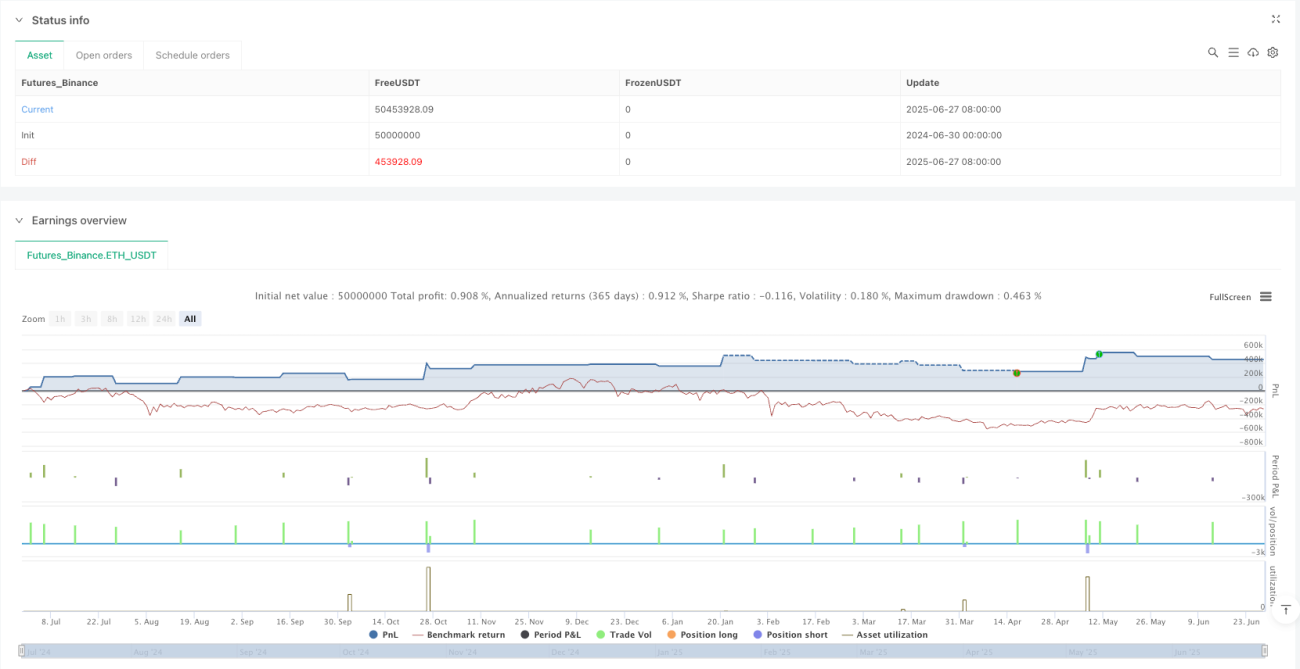
/*backtest
start: 2024-06-30 00:00:00
end: 2025-06-28 08:00:00
period: 1d
basePeriod: 1d
exchanges: [{"eid":"Futures_Binance","currency":"ETH_USDT","balance":50000000}]
*/

//@version=6
strategy("HMA Crossover + ATR + Curvature (Long & Short)", overlay=true, default_qty_type=strategy.percent_of_equity, default_qty_value=100)

// === Inputs ===- 1