
Strategy Overview
This quantitative trading strategy is a comprehensive trading system that combines multiple technical indicators to capture different trading opportunities in the market. The core of the system consists of the Ichimoku Cloud (a multifunctional trend indicator), Relative Strength Index (RSI), and Volume Weighted Moving Average (VWMA), with Average True Range (ATR) used to dynamically set stop-loss and take-profit levels. The strategy suite offers four different sub-strategies, each targeting different market environments: trend-following ("IchimokuRSITrend"), moving average bounce ("VWMA_RSIBounce"), divergence reversal ("DivergenceReversal"), and flat breakout ("FlatBreakout"). This modular design allows traders to flexibly choose the most suitable strategy variant based on current market conditions, enhancing the strategy's adaptability and practicality.
Strategy Principles
The core principle of this strategy is to confirm trading signals through a combination of multiple indicators, thereby improving signal reliability. Specifically:
-
Ichimoku Cloud Components:
- Calculate Tenkan-sen (Conversion Line, 9-period high-low average)
- Calculate Kijun-sen (Base Line, 26-period high-low average)
- Calculate Senkou Span A (Leading Span A, average of Tenkan and Kijun)
- Calculate Senkou Span B (Leading Span B, 52-period high-low average)
- Determine price position relative to the cloud and the relationship between Tenkan and Kijun
-
RSI Indicator: Uses standard 14-period RSI to measure price momentum and overbought/oversold conditions
-
VWMA Indicator: 20-period Volume Weighted Moving Average, used to confirm price trends
-
ATR Indicator: Used to dynamically set stop-loss and take-profit levels, adaptively adjusting based on market volatility
Depending on the selected strategy type, the system activates different signal generation logic:
- Trend Following (IchimokuRSITrend): Generates long signals when price is above the cloud, Tenkan is above Kijun, RSI is above 50, and price is above VWMA; generates short signals under opposite conditions
- Moving Average Bounce (VWMA_RSIBounce): Generates long signals when price crosses above VWMA, RSI is above 35, and Tenkan is above Kijun; generates short signals under opposite conditions
- Divergence Reversal (DivergenceReversal): Generates long signals when RSI bullish divergence is detected, Tenkan is above Kijun, and VWMA is above price; generates short signals under opposite conditions
- Flat Breakout (FlatBreakout): Generates long signals when Tenkan is flat (difference from Kijun less than 1.0), RSI is above 55, and price is above VWMA; generates short signals under opposite conditions
Whenever a trading signal is generated, the system sets dynamic stop-loss and take-profit levels based on the ATR value, with default settings of 1.5x ATR for stop-loss and 3.0x ATR for take-profit, ensuring that risk management is consistent with market volatility.
Strategy Advantages
-
Multi-dimensional Confirmation Mechanism: By combining Ichimoku Cloud, RSI, and VWMA, the strategy achieves confirmation of trading signals from three dimensions: trend, momentum, and volume, significantly reducing the risk of false signals.
-
Strong Adaptability: The strategy suite provides four different sub-strategies, capable of adapting to different market environments, from trending markets to oscillating markets.
-
Dynamic Risk Management: Using the ATR indicator to dynamically set stop-loss and take-profit levels allows risk management to automatically adjust with market volatility, avoiding the limitations of fixed-level stops in different volatility environments.
-
Anti-Duplicate Signal Mechanism: By tracking the previous signal state (prevSignal variable), the strategy avoids generating consecutive signals in the same direction, reducing unnecessary trading costs.
-
Visual Assistance: Each trading signal and its source strategy are clearly marked on the chart with labels, facilitating backtest analysis and real-time monitoring.
-
Modular Design: The code structure is clear with separate functional modules, facilitating subsequent maintenance and expansion, such as easily adding new strategy variants or adjusting existing strategy parameters.
Strategy Risks
-
Parameter Sensitivity: The strategy uses multiple technical indicators, each with its own parameter settings, making the strategy sensitive to parameter selection. Different markets or timeframes may require different parameter combinations for optimal results. The solution is to conduct thorough parameter optimization and backtesting to find robust parameter combinations.
-
Signal Lag Risk: Technical indicators are inherently lagging, especially moving average-type indicators, which may lead to late entries near trend turning points. The solution is to consider adding some leading indicators or shortening certain indicator periods to improve signal timeliness.
-
Overtrading Risk: The four strategies may generate frequent signals under certain market conditions, leading to overtrading. The solution is to add signal filtering conditions or implement a trading cooldown mechanism to limit trading frequency within a short period.
-
Cloud Interpretation Complexity: The Ichimoku Cloud is a relatively complex indicator system, and correct interpretation requires experience. The solution is to deeply learn the principles of using the Ichimoku Cloud, or consider simplifying the cloud usage by only adopting its core components.
-
Simplified RSI Divergence Detection: The RSI divergence detection in the code uses a simplified algorithm, which may not capture all valid divergence patterns. The solution is to improve the divergence detection algorithm and adopt more precise extremum judgment methods.
-
Fixed Stop-Loss/Take-Profit Ratios: Although ATR is used to dynamically set stop-loss and take-profit levels, the ATR multiples are fixed, which may not be suitable for all market conditions. The solution is to dynamically adjust ATR multiples based on market volatility characteristics or strategy type, or implement a trailing stop strategy.
Strategy Optimization Directions
-
Improve Divergence Detection Algorithm: The current RSI divergence detection in the code uses a simplified method. This can be improved by implementing more complex peak-valley detection algorithms to enhance divergence identification accuracy. Specifically, ZigZag indicators or fractal theory can be used to identify key turning points in price and indicators, then compare the relative positions of these points to determine divergence.
-
Add Time Filters: Many markets exhibit different characteristics at different times. Adding time filtering conditions can enable or disable certain strategies during specific trading sessions to avoid inefficient trading periods.
-
Increase Volume Confirmation: Although the strategy uses VWMA, direct volume analysis can be further added, such as requiring the volume when a signal is generated to be higher than the average volume of the previous N periods, enhancing signal reliability.
-
Implement Adaptive Parameters: Design key parameters (such as RSI thresholds, ATR multiples, etc.) to automatically adjust according to market volatility conditions. For example, use more relaxed RSI thresholds and larger stop-loss distances in high-volatility markets, and vice versa.
-
Add Trend Strength Filtering: Introduce trend strength indicators such as ADX, using trend-following strategies only when trend strength is sufficient, and switching to reversal or oscillation strategies when the trend is weak, improving strategy adaptability.
-
Implement Partial Position Management: The current strategy uses a fixed position size (default is 10% of account funds). Dynamic position management based on signal strength, market volatility, or account equity curve can be implemented. For example, increase position size when signals are stronger and reduce position size in high-volatility environments.
-
Add Trailing Stop Functionality: In addition to fixed ATR multiple stops, implement trailing stop functionality that automatically adjusts stop-loss levels as price moves in a favorable direction, locking in partial profits while giving price enough breathing room.
-
Integrate Machine Learning Methods: Consider using machine learning algorithms to optimize strategy parameters or filter signals. For example, use random forests or support vector machine classifiers to evaluate the reliability of each signal and filter out low-quality signals.
Summary
The Multi-Indicator Integrated Trading System is a comprehensive and flexibly designed quantitative trading strategy suite that provides traders with solutions for various market environments by integrating the Ichimoku Cloud, RSI, and VWMA technical indicators, combined with ATR dynamic risk management. The main advantages of this strategy lie in its multi-dimensional signal confirmation mechanism, flexibility in strategy selection, and dynamic risk management methods, which together enhance the strategy's robustness and adaptability.
At the same time, we need to recognize the risks in the strategy, such as parameter sensitivity, signal lag, and simplified divergence judgment. To address these risks, we have proposed several optimization directions, including improving divergence detection algorithms, adding time filters, implementing adaptive parameters, and adding trailing stop functionality. These optimization measures can further enhance the strategy's performance and stability.
Overall, this strategy system provides traders with a solid trading framework that can be directly applied to actual trading or serve as a foundation for further development and customization. Through continuous optimization and adjustment, this strategy has the potential to achieve stable trading performance in various market environments.
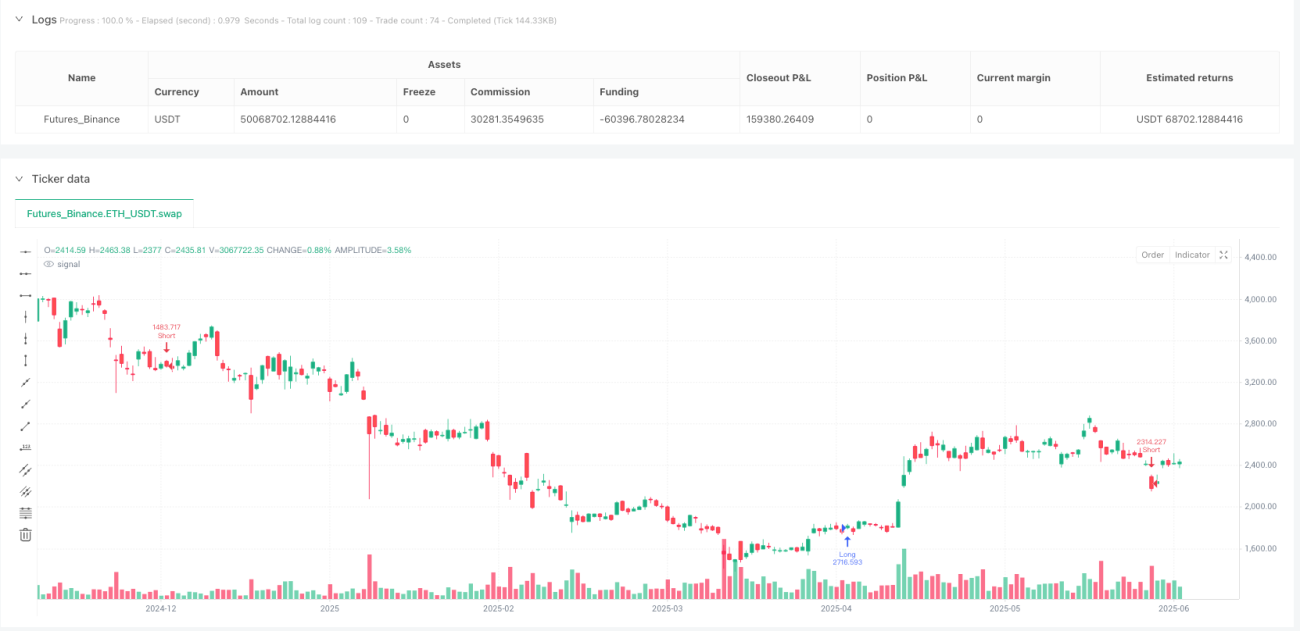
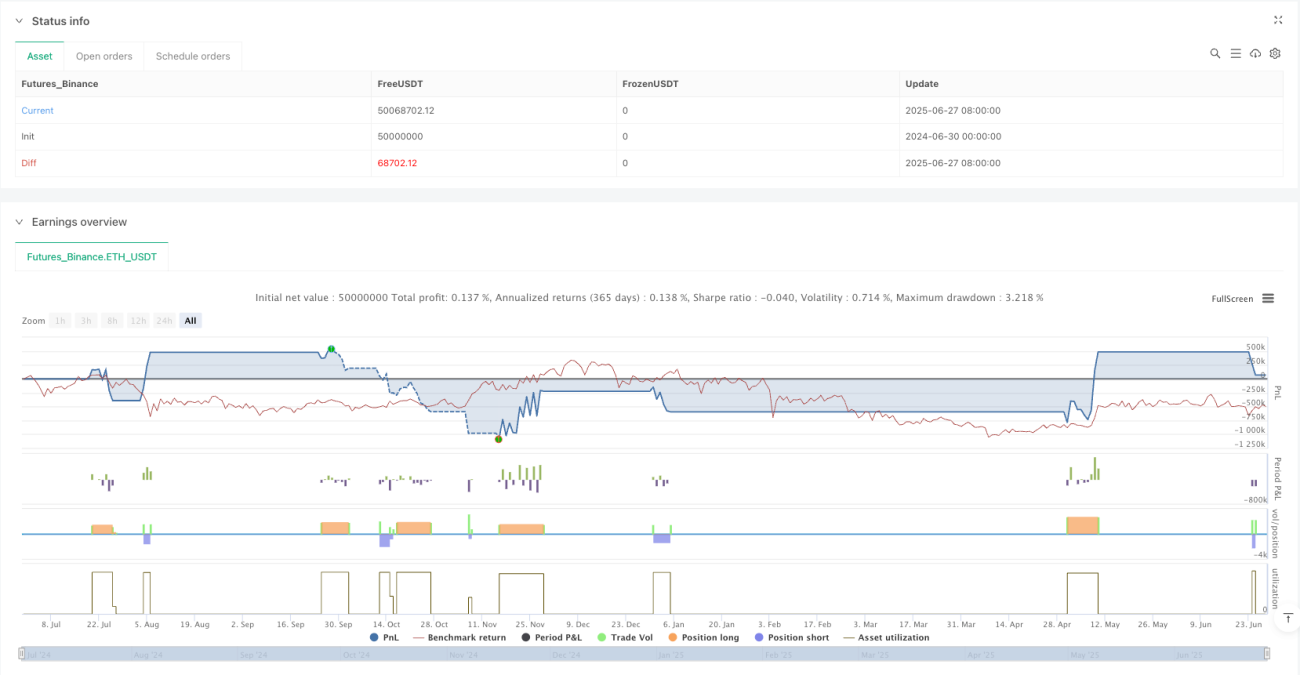
/*backtest
start: 2024-06-30 00:00:00
end: 2025-06-28 08:00:00
period: 1d
basePeriod: 1d
exchanges: [{"eid":"Futures_Binance","currency":"ETH_USDT","balance":50000000}]
*/

//@version=5
strategy("Ichimoku + RSI + VWMA Strategy Suite (w/ ATR SLTP)", overlay=true, default_qty_type=strategy.percent_of_equity, default_qty_value=10)

// === STRATEJI SECIMI === //- 1