
Overview
The Weighted Moving Average and Inverse Fisher Transform CCI Momentum Filtering Multi-Strategy System is a quantitative trading strategy that combines technical analysis with momentum filtering. The strategy is primarily based on two core components: Weighted Moving Average (WMA) crossovers and an Inverse Fisher Transform (IFT) CCI indicator filtering system. The strategy uses the crossover of 50-period and 200-period WMAs to determine market trend direction, while utilizing the IFT-CCI indicator to filter out noisy signals, executing trades only when trend momentum is sufficiently strong. Additionally, the strategy incorporates sophisticated risk management and profit protection mechanisms, including trailing take-profit and fixed stop-loss, to enhance the risk-reward ratio of trades. The core advantage of this strategy lies in its comprehensiveness and adaptability, being able to identify market trends while effectively filtering out false signals, and enhancing the visual trading experience through labels and graphical cues.
Strategy Principles
The working principles of this strategy are based on several key mechanisms:
-
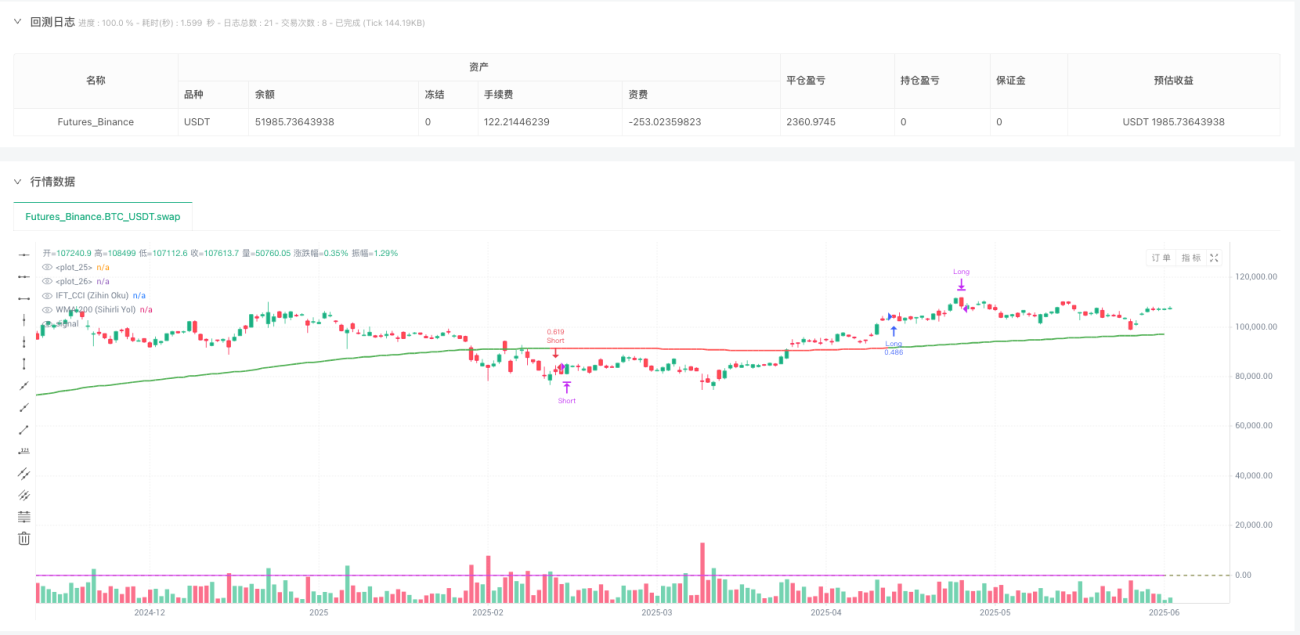
Trend Identification System: The strategy uses 50-period and 200-period Weighted Moving Averages (WMA) as the foundation for trend identification. When the short-term WMA (50-period) crosses above the long-term WMA (200-period), a potential long signal is formed; when the short-term WMA crosses below the long-term WMA, a potential short signal is formed.
-
Momentum Filtering Mechanism: The strategy employs an Inverse Fisher Transform (IFT) based on the Commodity Channel Index (CCI) as a momentum filter. The IFT-CCI indicator transforms CCI values into a range between -1 and 1, providing clearer market momentum signals. Long trades are only considered when the IFT-CCI value exceeds 0.5, and short trades when it falls below -0.5.
-
Signal Confirmation and Delayed Entry: The strategy features a unique "ready state" mechanism. When a trend signal appears but momentum filtering conditions are not met, the strategy enters a "ready state." Only when momentum conditions are satisfied and the trend direction remains unchanged does the strategy execute a trade. This mechanism effectively reduces losses from false signals.
-
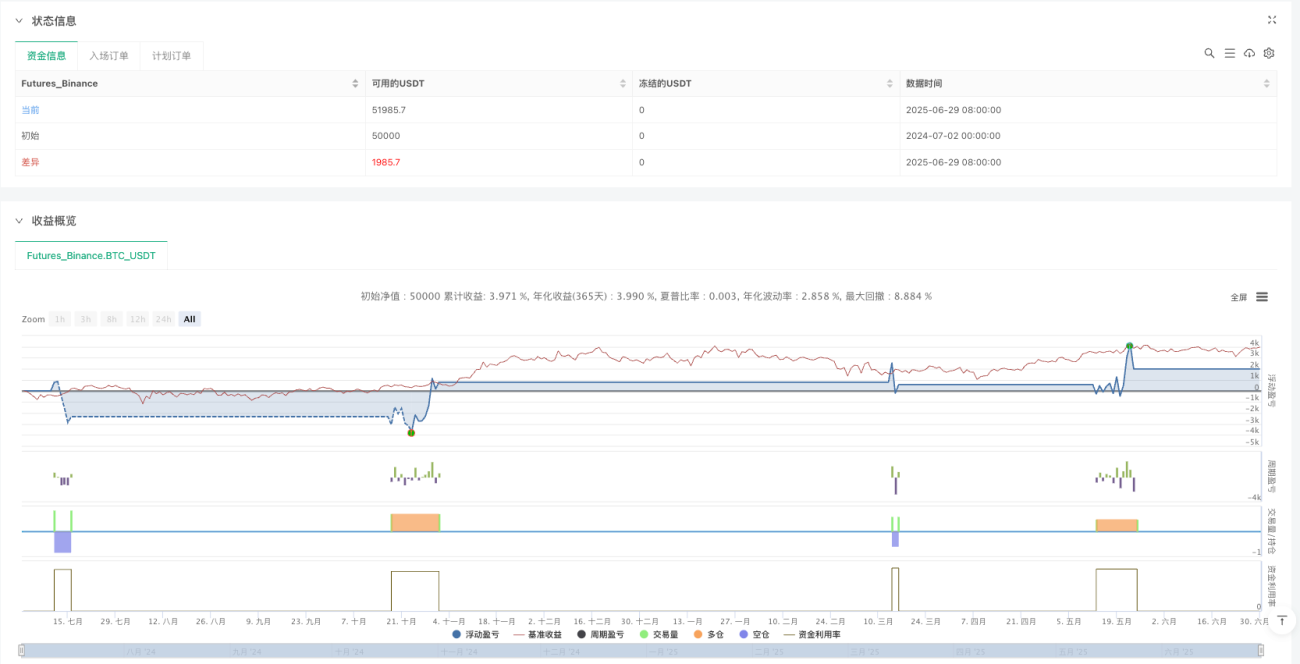
Dynamic Risk Management: The strategy implements percentage-based trailing take-profit and fixed stop-loss mechanisms. When the price reaches a specified profit percentage (default 3%), trailing take-profit is activated; if the retracement exceeds a set percentage (default 1%), the position is automatically closed. Simultaneously, the strategy sets a maximum loss percentage (default 3%) as the final line of defense for risk control.
-
Visual Feedback System: The strategy uses labels and emojis on the chart to mark key signals and events, including WMA crossovers, trade entries and exits, enhancing the visibility and intuitiveness of the trading process.
In the code implementation, the strategy first calculates WMA and IFT-CCI indicators, then determines trading signals based on these indicators and current market conditions. The trade execution logic includes handling various scenarios, such as trend changes, signal confirmation, and risk management, ensuring the strategy can flexibly respond to different market environments.
Strategy Advantages
This strategy has several significant advantages that allow it to maintain relatively stable performance under various market conditions:
-
Comprehensive Trend Identification Capability: By combining short-term and long-term weighted moving averages, the strategy can accurately identify major market trends, avoiding frequent trading in sideways markets and reducing unnecessary trading costs.
-
Effective Noise Filtering: The Inverse Fisher Transform CCI indicator provides a powerful momentum filtering mechanism, helping the strategy filter out a large amount of market noise and false signals, significantly improving signal quality and trading success rate.
-
Flexible Signal Confirmation Mechanism: The design of the "ready state" allows the strategy to wait for momentum confirmation after a trend signal appears. This delayed entry mechanism effectively reduces losses from false breakouts while not missing genuine trend opportunities.
-
Dynamic Risk Management System: The strategy's trailing take-profit and fixed stop-loss mechanisms provide comprehensive risk protection, both maximizing profits in trending markets and limiting losses in reversing markets, greatly improving the strategy's risk-reward ratio.
-
Intuitive Visual Feedback: The label and emoji system on the chart provides traders with clear visual feedback, helping them better understand the strategy's decision-making process and market conditions, improving trading experience and strategy transparency.
-
Adaptive Market Characteristics: The strategy can adapt to different market conditions and cycles, finding suitable trading opportunities whether in trending or oscillating markets, demonstrating strong adaptability and robustness.
-
Emotional Management Advantage: Through clear rules and objective indicators, the strategy reduces subjective judgment and emotional influence in the trading process, helping traders maintain discipline and consistency, improving the stability of trading results in the long term.
Strategy Risks
Despite its well-designed nature, there are several risk factors that need attention:
-
Parameter Sensitivity Risk: Strategy performance is highly dependent on selected parameters, such as WMA periods, CCI length, profit targets, and stop-loss levels. Improper parameter settings may lead to over-optimization or poor performance. It is recommended to validate parameter robustness through backtesting under different market conditions and consider using adaptive parameters to mitigate this risk.
-
Trend Change Delay Risk: Moving averages are lagging indicators and may only signal after a market trend has already changed. In rapidly reversing markets, this delay can lead to significant losses. Consider introducing more sensitive early warning indicators, such as price volatility or momentum change rates, to identify potential trend changes in advance.
-
Overtrading Risk: In oscillating markets, WMAs may cross frequently, leading to excessive trading signals and unnecessary trading costs. Although the IFT-CCI filter helps mitigate this problem, it is still necessary to monitor trading frequency and consider temporarily disabling the strategy in sideways markets.
-
Correlation Failure Risk: Under extreme market conditions, normal correlations between indicators may temporarily fail, leading to poor strategy performance. It is recommended to implement market state detection mechanisms to reduce position sizes or pause trading under abnormal market conditions to lower risk.
-
Fixed Percentage Risk: The strategy uses fixed percentages for take-profit and stop-loss, which may not be suitable for all market environments. In high-volatility markets, fixed percentages may be too small; in low-volatility markets, they may be too large. Consider implementing dynamic take-profit and stop-loss levels based on market volatility to better adapt to different market environments.
-
Backtesting vs. Real Trading Difference Risk: Backtesting results may not fully reflect actual trading conditions, as they typically do not account for factors such as slippage, rejected orders, and liquidity issues. It is recommended to conduct paper trading before live trading and initially use smaller position sizes to verify strategy performance in real environments.
-
Single Strategy Dependence Risk: Over-reliance on a single strategy may lead to unstable long-term performance. It is recommended to use this strategy as part of a broader trading system, combined with other non-correlated strategies, to diversify risk and improve overall stability.
Optimization Directions
Based on the analysis of strategy logic and potential risks, here are several possible optimization directions:
-
Adaptive Parameter Optimization: The current strategy uses fixed WMA and CCI parameters. Consider implementing an adaptive parameter system that dynamically adjusts these parameters based on market volatility and cyclicality. For example, using shorter WMA periods in high-volatility markets and longer periods in low-volatility markets to improve the strategy's adaptability to different market environments.
-
Multiple Timeframe Analysis Integration: Building on the current single timeframe foundation, add multiple timeframe analysis, using longer-period trend information as a trading filter condition. For example, only execute trades when daily and 4-hour trends are aligned, which can significantly improve signal quality and success rate.
-
Market State Classification Mechanism: Introduce a market state classification system that differentiates markets into trending, oscillating, and transitional states, applying different trading parameters and strategies for different market states. For example, more aggressively tracking profits in strong trending markets while setting more conservative targets in oscillating markets.
-
Dynamic Risk Management Optimization: Replace fixed percentage settings with dynamic stop-loss and take-profit levels based on ATR (Average True Range) or historical volatility. This will make risk management better adapt to the actual volatility characteristics of the market, improving capital management efficiency.
-
Sentiment Indicator Integration: Consider integrating market sentiment indicators (such as volume, volatility change rate, or market breadth) into the signal filtering system. These indicators can provide additional information about market participant sentiment, helping to identify potential trend continuation or reversal.
-
Machine Learning Enhancement: Use machine learning techniques to optimize the strategy's decision-making process, especially in signal confirmation and risk management. Machine learning models can identify optimal entry and exit points based on historical data, improving the strategy's accuracy and robustness.
-
Related Asset Correlation Analysis: Introduce correlation analysis of related assets as an additional layer of signal confirmation. When multiple related assets show consistent trend signals, the credibility of the signal and the position size of the trade can be increased, enhancing the overall effectiveness of the strategy.
Conclusion
The Weighted Moving Average and Inverse Fisher Transform CCI Momentum Filtering Multi-Strategy System is a comprehensive and powerful quantitative trading strategy that cleverly combines the three core elements of trend following, momentum filtering, and risk management to form a balanced and efficient trading system. The main advantage of the strategy lies in its multi-layer signal confirmation mechanism, identifying trend direction through WMA crossovers, then confirming signal strength through the IFT-CCI momentum filter, and finally preventing false breakouts through the "ready state" mechanism, greatly improving the quality and reliability of trading signals.
At the same time, the strategy's dynamic risk management system both protects capital safety and maximizes profits in trending markets, demonstrating good risk-reward characteristics. The visual feedback system enhances the strategy's usability and transparency, helping traders better understand and execute trading decisions.
Despite potential risks such as parameter sensitivity, signal delay, and market adaptability, these risks can be effectively mitigated through the proposed optimization directions, such as adaptive parameters, multiple timeframe analysis, market state classification, and dynamic risk management, further enhancing the strategy's robustness and adaptability.
Overall, by balancing the objectivity of technical analysis and the flexibility of dynamic risk management, this strategy can maintain relatively stable performance in different market environments, making it suitable as a foundational strategy for medium to long-term quantitative trading. For investors and traders seeking reliable, systematic trading methods, this is a worthy consideration. Through further optimization and personalization, this strategy has the potential to become an even more refined and efficient trading system.
//@version=5
//策略初始化:设置策略名称和基本参数
strategy("Intelligent Entry Strategy", overlay=false, default_qty_type=strategy.percent_of_equity,
    default_qty_value=100)

//WMA移动平均线系统:用于判断市场趋势方向
wmaFast = ta.wma(close, 50);//快速WMA,50周期
wmaSlow = ta.wma(close, 200);//慢速WMA,200周期

//绘制WMA200线:根据快慢线关系显示不同颜色
plot(wmaSlow, title="WMA 200 (Magic Line)", color=wmaFast > wmaSlow ? color.green : color.red,
linewidth=2, overlay = true)- 1