Triple-Phase Volume-RSI Momentum Reversal Quantitative Strategy

Overview
This strategy combines volume analysis with RSI (Relative Strength Index) momentum indicators to identify potential market reversals. It specifically looks for exhaustion patterns where volume decreases during a trend continuation but then increases during the initial reversal bar. Combined with RSI divergence patterns in oversold or overbought conditions, this creates a powerful signal for potential trend reversals.
Strategy Principles
The Triple-Phase Volume-RSI Momentum Reversal Strategy operates on two key technical components:
-
Volume Exhaustion Pattern:
- For long entries: The strategy identifies two consecutive red (down) bars followed by a green (up) bar. The first red bar must have the highest volume of the three bars, with volume decreasing on the second red bar and then increasing on the green bar. This pattern suggests selling pressure is exhausting.
- For short entries: The pattern is reversed, looking for two consecutive green bars followed by a red bar, with similar volume characteristics. The highest volume should be on the first green bar, decreasing on the second, and then increasing on the red bar.
-
RSI Pattern Recognition:
- For long entries: The RSI forms a "V" shape pattern with the trough reaching oversold territory (≤ 30). The strategy confirms the RSI is rising from this trough.
- For short entries: The RSI forms an inverted "V" with the peak reaching overbought territory (≥ 70). The strategy confirms the RSI is falling from this peak.
Both conditions must be met simultaneously for the strategy to generate an entry signal. The trade is executed at the close of the trigger candle. The strategy includes a 1% stop-loss for risk management, calculated from the entry price.
Strategy Advantages
-
Dual Confirmation Mechanism: By combining volume analysis with RSI indicators, the strategy provides stronger confirmation than either indicator alone, potentially reducing false signals.
-
Early Reversal Detection: The strategy is designed to catch reversals near their inception, allowing for favorable risk-to-reward ratios.
-
Adaptability: The strategy can be applied to various timeframes (though it works best on 5-15 minute charts) and different markets, particularly those with high volume characteristics.
-
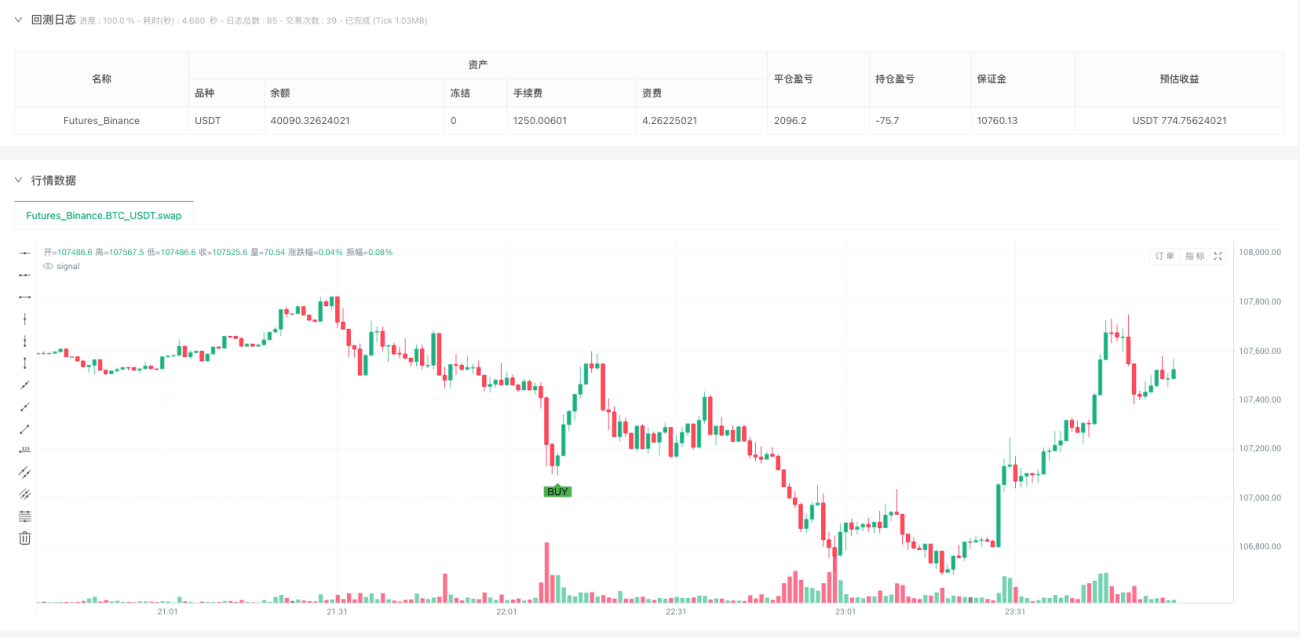
Visual Clarity: The strategy plots clear BUY/SELL labels directly on the chart, making it easy to identify signals in real-time or during backtesting.
-
Integrated Risk Management: The built-in stop-loss mechanism helps protect capital by automatically limiting potential losses to 1% per trade.
-
Counter-Trend Opportunity: This strategy provides a systematic approach to counter-trend trading, which can be particularly profitable during market corrections or in choppy market conditions.
Strategy Risks
-
False Signals in Trending Markets: During strong trends, the strategy might generate signals too early, leading to potential losses as the trend continues.
-
Volume Reliability Issues: Not all trading platforms provide accurate volume data, especially in forex markets. Inaccurate volume data would severely impact the effectiveness of this strategy.
-
Fixed Stop-Loss Limitations: The 1% fixed stop-loss might be too tight for high-volatility instruments or too loose for low-volatility ones. This one-size-fits-all approach to risk management could be suboptimal.
-
RSI Limitations in Extended Conditions: During prolonged overbought or oversold conditions, RSI can remain at extreme levels for extended periods, potentially generating premature signals.
-
No Take-Profit Mechanism: The strategy lacks a defined exit strategy for profitable trades, which could lead to giving back profits if the market reverses again.
-
Execution Delay Risk: Since the strategy enters at the close of the trigger candle, there could be slippage or missed opportunities, especially in fast-moving markets.
Optimization Directions
-
Dynamic Stop-Loss Implementation: Instead of a fixed 1% stop-loss, implementing an ATR-based (Average True Range) stop-loss would better adapt to current market volatility conditions.
-
Adding Take-Profit Parameters: Implementing a systematic take-profit mechanism, perhaps based on risk-reward ratios or prior support/resistance levels, would complete the trading system.
-
Volume Filtration: Adding a volume threshold relative to recent average volume would ensure signals are only generated during periods of significant market activity.
-
Trend Filter Integration: Adding a higher timeframe trend filter (such as a 200-period moving average) could improve performance by aligning counter-trend trades with the larger market direction.
-
Timeframe Optimization: The code could be enhanced to automatically determine the optimal RSI period based on the selected timeframe rather than using a fixed 14-period setting.
-
Signal Confirmation Delay: Adding a confirmation requirement, such as waiting for the next candle to close in the direction of the trade, could reduce false signals at the cost of later entries.
Summary
The Triple-Phase Volume-RSI Momentum Reversal Strategy represents a sophisticated approach to identifying potential market reversals by combining volume analysis with RSI momentum indicators. Its strength lies in the dual confirmation mechanism, requiring both volume exhaustion patterns and RSI extremes to generate signals.
While the strategy offers advantages in early reversal detection and visual clarity, it faces challenges related to false signals in trending markets and limitations in its risk management approach. The outlined optimization directions—particularly implementing dynamic stop-loss mechanisms, adding take-profit parameters, and integrating trend filters—would significantly enhance the strategy's robustness.
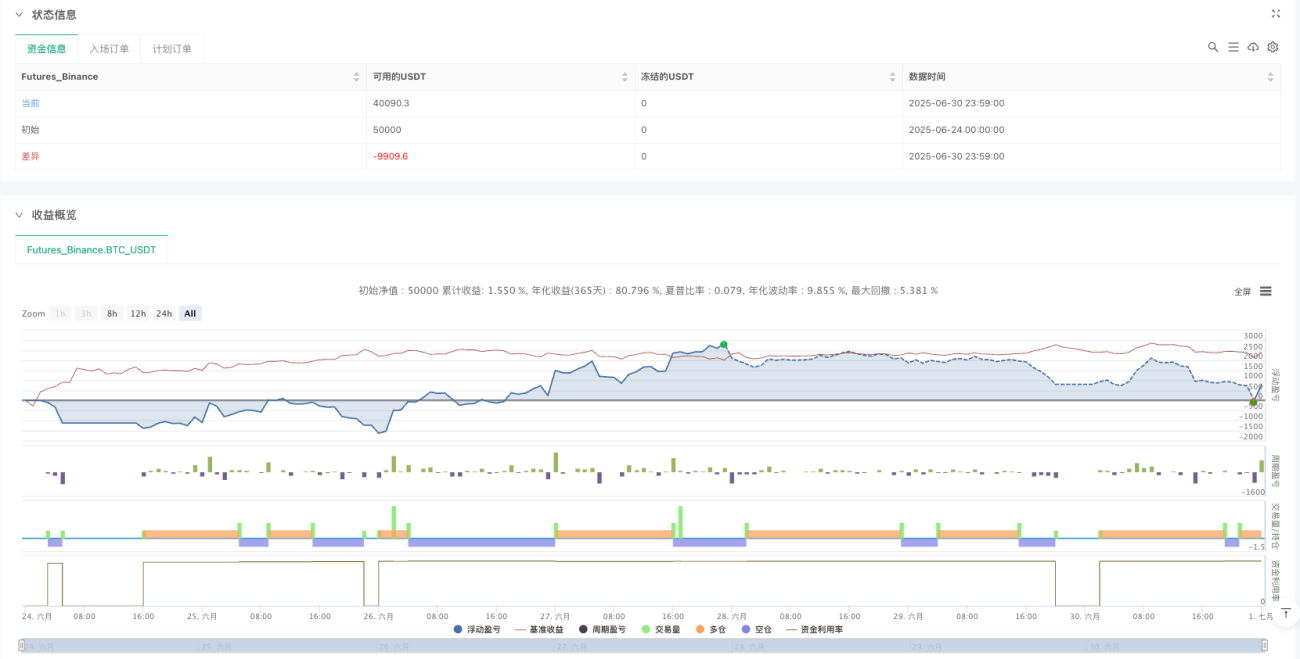
For traders interested in counter-trend opportunities, this strategy provides a systematic framework that can be further customized to match individual risk preferences and market conditions. As with any trading strategy, thorough backtesting across different market conditions is essential before live implementation.
/*backtest
start: 2025-06-24 00:00:00
end: 2025-07-01 00:00:00
period: 1m
basePeriod: 1m
exchanges: [{"eid":"Futures_Binance","currency":"BTC_USDT"}]
*/

//@version=5
// Note: Changed version to 5 as //@version=6 is not yet released.
// If you are using a beta version, you can change it back to 6.
strategy("Volume Exhaustion RSI Reversal Strategy", overlay=true, margin_long=100, margin_short=100)- 1