
Overview
The Multi-Indicator Breakout Trend Following Strategy is a quantitative trading approach based on the classic Turtle Trading system, designed to capture strong market trends through multi-period breakout signals. The core of this strategy lies in utilizing price breakouts across different time periods as entry and exit signals, while incorporating ATR (Average True Range) for risk control and position sizing. This strategy can function both as an indicator to identify market breakout signals and as a complete automated trading system. Its strength lies in systematically capturing trending opportunities while enhancing capital efficiency through strict risk management.
Strategy Principles
The fundamental principle of this strategy is to identify potential trend movements by recognizing when prices break through historical highs or lows. The specific implementation logic is as follows:
-
Entry Mechanism: The strategy uses the highest and lowest prices over the N1 period (default 20 periods) as breakout references. When the price breaks above the highest price of the previous N1 periods, a long entry signal is generated; when the price breaks below the lowest price of the previous N1 periods, a short entry signal is generated.
-
Exit Mechanism: The strategy employs a dual exit mechanism:
- Stop Loss Exit: Dynamic stop loss levels are set based on ATR, defaulting to the entry price minus (for longs) or plus (for shorts) 2 times the ATR value.
- Trend Reversal Exit: When the price falls below the lowest price of the N2 period (default 10 periods), long positions are closed; when the price breaks above the highest price of the N2 period, short positions are closed.
-
Position Management: The strategy calculates trading unit size based on volatility (ATR) and risk ratio, ensuring that each trade's risk is controlled at a fixed percentage (default 1%) of account capital. The calculation formula is:
Trading Units = Risk Amount / (ATR * Value Per Point)where Risk Amount equals the initial capital multiplied by the risk percentage.
-
Trade Execution: The strategy only executes new entry signals when there are no existing positions, avoiding repeated entries, while recording the entry price for calculating stop loss positions.
Strategy Advantages
-
Trend Following Capability: The strategy is focused on capturing major trends by identifying potential trend starting points through breakout signals, effectively utilizing trending market movements.
-
Dynamic Risk Control: Stop loss positions are calculated using ATR, dynamically adjusting the stop loss distance based on actual market volatility. This approach avoids both the frequent stops caused by fixed stops being too close and the excessive losses from stops being too far.
-
Adaptive Position Sizing: Position size is dynamically adjusted based on market volatility and account risk ratio, automatically reducing positions in highly volatile markets and appropriately increasing positions in low volatility markets, achieving balanced control of risk exposure.
-
Parameter Adjustability: The strategy provides interfaces for adjusting multiple key parameters (N1, N2, ATR period, risk ratio, etc.), allowing users to optimize based on different market environments and personal risk preferences.
-
Systematic Trading: Fully systematized trading rules eliminate emotional interference, strictly following preset entry, exit, and capital management rules, improving trading discipline.
Strategy Risks
-
Poor Performance in Ranging Markets: As a trend following strategy, it tends to generate frequent false breakout signals in sideways, ranging markets, leading to consecutive stop losses. A solution could be to add volatility filtering conditions, considering entry only when volatility exceeds a certain threshold.
-
Slippage and Commission Impact: In high-frequency trading or markets with insufficient liquidity, slippage and commissions may significantly affect strategy performance. This issue can be mitigated by reducing trading frequency or adding signal confirmation mechanisms.
-
Parameter Sensitivity: Strategy performance is relatively sensitive to N1 and N2 parameter settings, with optimal parameters potentially varying greatly across different markets and timeframes. It is recommended to find robust parameter combinations through historical backtesting, avoiding curve-fitting from excessive optimization.
-
Gap Risk: In price gaps caused by sudden major events, stop loss orders may not execute at the expected price, causing losses beyond expectations. Consider adding maximum loss limits or introducing volatility adjustment factors.
-
Capital Management Risk: Despite the strategy's risk control mechanisms, consecutive stop losses in extreme market conditions may still lead to significant drawdowns in the capital curve. It is advisable to set limits on the maximum number of consecutive losses or introduce overall risk exposure controls.
Optimization Directions
-
Multi-Timeframe Confirmation: Introduce longer period trend confirmation mechanisms, considering entry only when trends across multiple timeframes are consistent, improving signal quality. For example, add conditions to check whether the daily trend direction is consistent with the current trading period's trend direction.
-
Volatility Filtering: Introduce volatility filtering conditions, executing trade signals only when market volatility is within a reasonable range, avoiding entry in overly calm or excessively volatile markets. Relative ATR values (such as ATR/price ratio) can be used as filtering indicators.
-
Signal Confirmation Mechanism: Add breakout confirmation mechanisms, such as requiring the price to maintain a certain time or amplitude after breakout before confirming signal validity, reducing losses from false breakouts.
-
Dynamic Parameter Adjustment: Dynamically adjust N1 and N2 parameters based on market conditions, using different parameter combinations in different volatility environments, improving the strategy's adaptability to market environments.
-
Incorporate Trend Strength Assessment: Combine trend strength indicators (such as ADX, linear regression slope, etc.) to evaluate current trend strength, considering entry only when trend strength reaches a certain threshold, improving the accuracy of trend capture.
-
Optimize Stop Loss Mechanism: Consider introducing trailing stops or support/resistance-based stop methods, giving trends more room to develop while maintaining risk control functionality.
Summary
The Multi-Indicator Breakout Trend Following Strategy is a systematic trading approach that combines classic Turtle Trading concepts with modern risk management techniques. By determining trend direction through multi-period price breakouts and implementing dynamic stop losses and position control with ATR, this strategy can effectively capture significant trending opportunities in the market.
The core advantages of this strategy lie in its systematic trading rules and strict risk control, avoiding emotional interference while providing high flexibility through parameter adjustments. However, as a trend following strategy, its performance may be poor in ranging markets, requiring users to understand its applicable scenarios and perform appropriate parameter optimization.
By introducing optimization directions such as multi-timeframe confirmation, volatility filtering, and signal confirmation mechanisms, this strategy has the potential to further improve signal quality and stability, adapting to more diverse market environments. Ultimately, the Multi-Indicator Breakout Trend Following Strategy provides traders with a reliable, systematic method to capture market trends while controlling risk, achieving long-term stable trading performance.
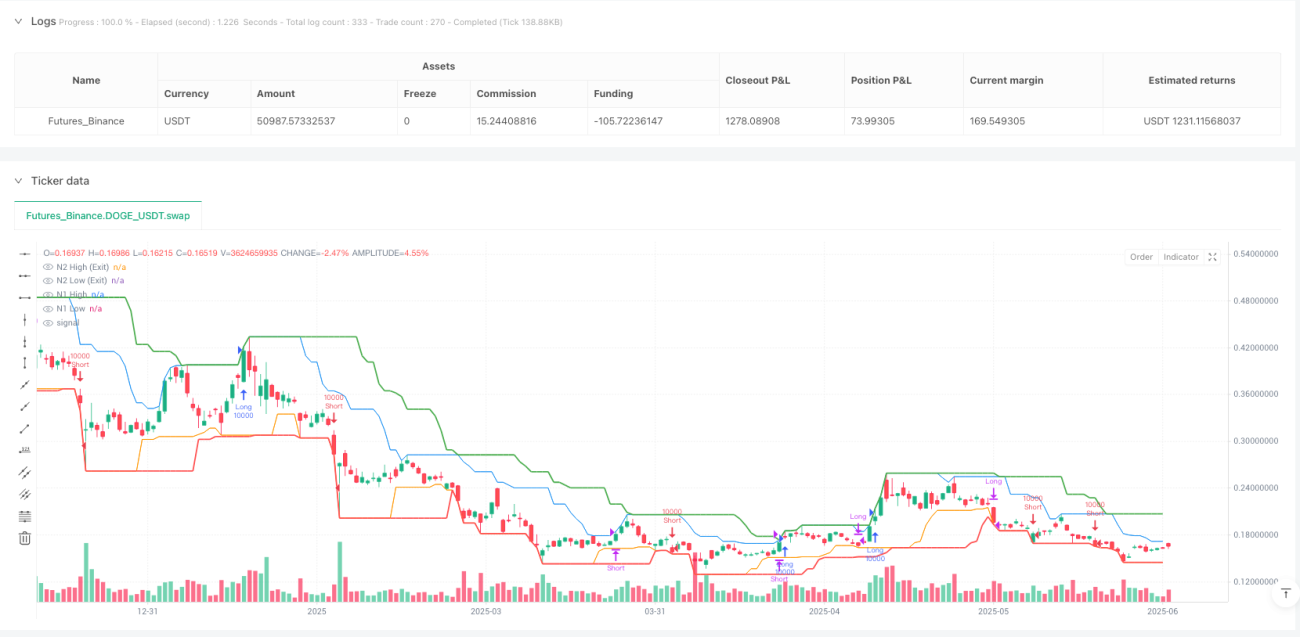
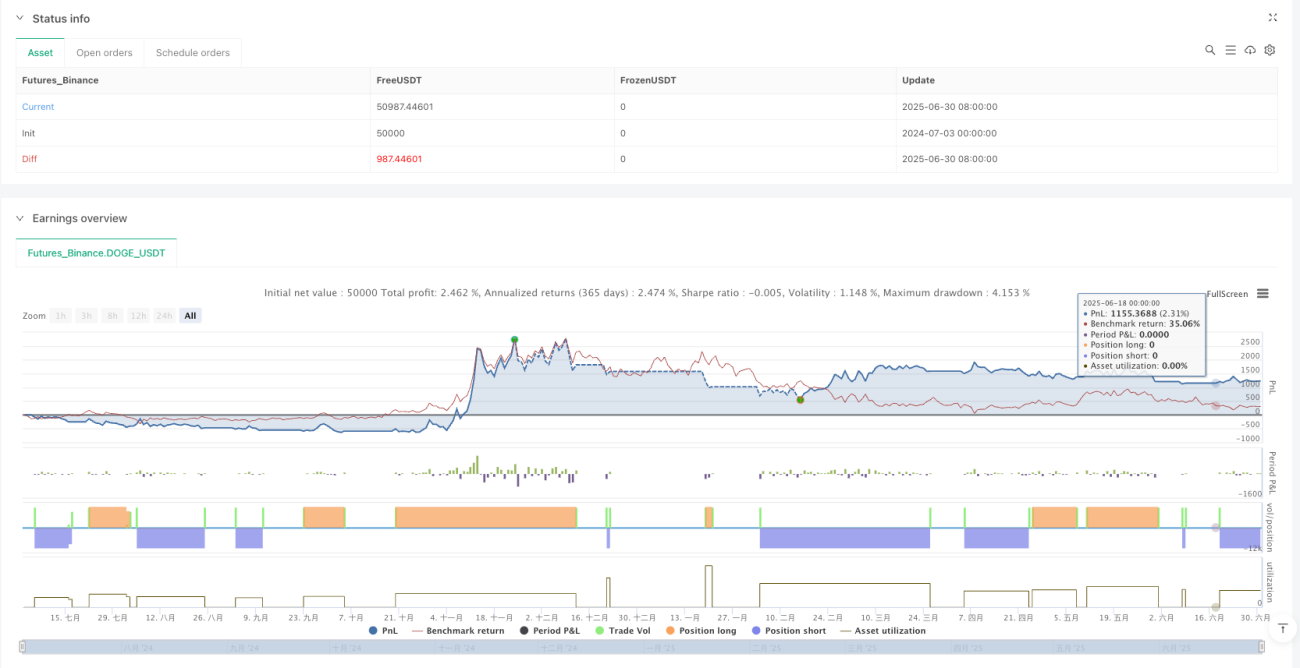
/*backtest
start: 2024-07-03 00:00:00
end: 2025-07-01 08:00:00
period: 1d
basePeriod: 1d
exchanges: [{"eid":"Futures_Binance","currency":"DOGE_USDT"}]
*/

//@version=5
strategy("Turtle Trading Strategy (Simplified)", overlay=true, initial_capital=10000, default_qty_type=strategy.cash, default_qty_value=1000, commission_type=strategy.commission.cash_per_order, commission_value=1)

// --- Strategy Inputs ---- 1