
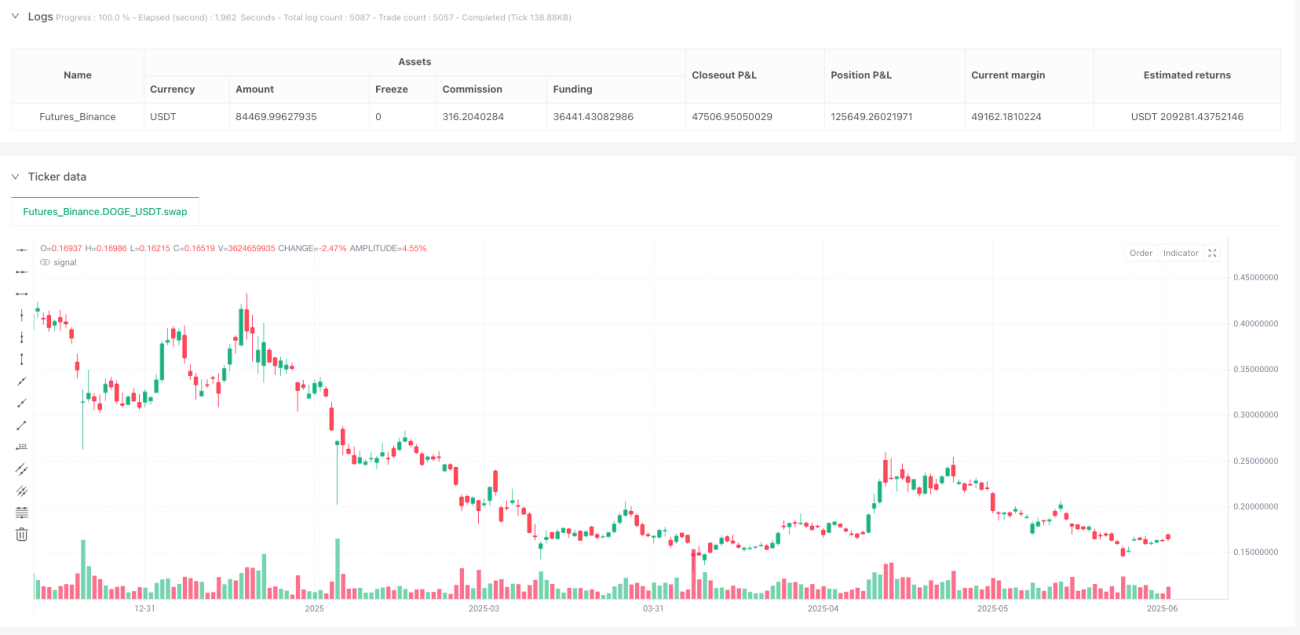
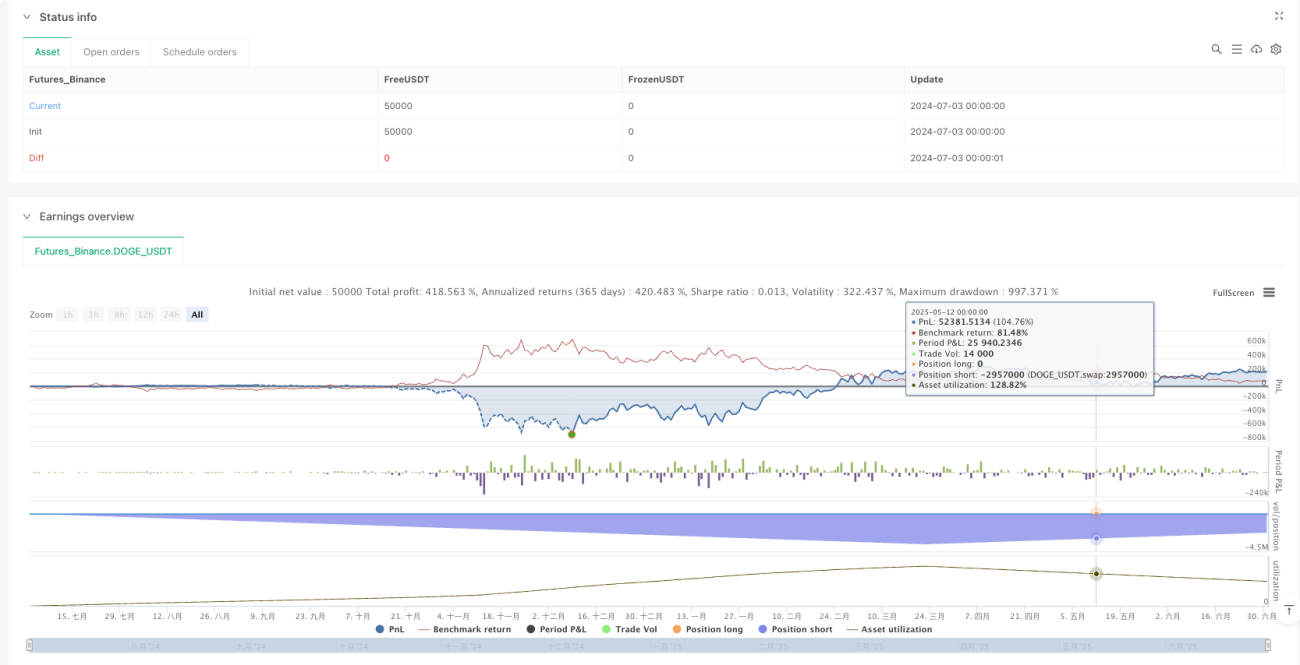
1. Overview
The RAHA Quantitative Dynamic Weight Moving Average Short-Term Trend Strategy is a short-term trading system based on the Roni's Adjusted Hybrid Average (RAHA) indicator. Developed by Aharon Roni Pesach, this strategy's core is a special moving average calculation method that assigns different weights to outliers, giving extreme values (particularly high or low) a lower weight. RAHA calculation is based on the standard deviation and average of the data, resulting in a more sensitive yet stable moving average that doesn't ignore outliers but considers them proportionally. The strategy identifies negative trends and enters when clear technical conditions are met, such as a downward slope of RAHA 40, RAHA 10 crossing below RAHA 20, and the absence of a sequence of 3 red candles. Entry is also made in the exceptional case of a red candle above the Bollinger Band. Position size is determined by 1% of capital divided by the stop loss distance, and exits are triggered by a stop above the high or additional conditions below the profit target (TP).
2. Strategy Principles
The core of the RAHA Quantitative Dynamic Weight Moving Average Short-Term Trend Strategy lies in its unique moving average calculation method. While traditional moving averages give each price point the same weight, RAHA dynamically adjusts weights based on how much price points deviate from the mean. The implementation follows these steps:
- First, calculate standard SMA and standard deviation
- For each price point, calculate weight based on its deviation from the mean: weight = 1 / (1 + sensitivity * |price-mean| / standard deviation)
- Use these weights to calculate the weighted average
The strategy uses RAHA moving averages of different periods (5, 10, 20, and 40) to capture market trends. Entry signals are based on the following conditions:
- RAHA 40 sloping downward (current value less than previous)
- RAHA 10 crossing under or positioned below RAHA 20
- RAHA 5 sloping downward
- No sequence of 3 consecutive red candles
- Or the special case: price completely above the Bollinger Band with a bearish candle
After entry, the strategy manages positions using these rules:
- Stop loss set at the highest price at entry
- Profit target (TP) set at entry price minus 3 times the stop loss distance
- Position size calculated as 1% of capital divided by stop loss percentage
- If 3 consecutive red candles appear, stop loss is adjusted to the high of the previous candle
- Exit conditions include: price crossing above RAHA 10, RAHA 10 crossing above RAHA 20, or price breaking through stop loss
3. Strategy Advantages
The RAHA Quantitative Dynamic Weight Moving Average Short-Term Trend Strategy offers several advantages:
-
Dynamic Weight Balance: The RAHA indicator creates a more sensitive yet stable moving average system by giving extreme values lower weights. This helps reduce false signals while maintaining sensitivity to genuine market changes.
-
Multi-level Trend Confirmation: The strategy uses RAHA indicators of multiple periods (5, 10, 20, and 40) for trend confirmation, and this multi-verification mechanism helps lower the false signal rate.
-
Risk Management Adaptation: Position size automatically adjusts based on stop loss distance, ensuring each trade controls risk at 1% of capital. This mechanism allows the strategy to adapt to different volatility environments.
-
Dynamic Stop Loss Adjustment: The strategy adjusts stop loss based on market conditions during trading, such as raising the stop loss position when 3 consecutive red candles appear, helping to lock in profits and reduce drawdowns.
-
Flexible Exit Mechanism: The strategy combines multiple exit mechanisms including technical indicator reversals and stop loss triggers, providing flexibility that helps optimize exit timing under different market conditions.
-
Exceptional Situation Capture: The strategy pays special attention to sell signals above the Bollinger Band, helping to capture retracement opportunities after excessive market expansion, which often bring significant returns.
-
Clear Visualization: The strategy marks entry and exit points on charts, allowing traders to intuitively understand trading logic, facilitating subsequent analysis and improvement.
4. Strategy Risks
Despite its many advantages, the RAHA Quantitative Dynamic Weight Moving Average Short-Term Trend Strategy faces several risks:
-
Sudden Trend Reversal Risk: The strategy primarily relies on trend continuation and may lead to significant losses in cases of sudden trend reversals. The solution is to consider adding more sensitive reversal indicators or market sentiment indicators as supplements.
-
Parameter Sensitivity: The sensitivity parameter in RAHA calculation (currently set at 1.5) significantly impacts strategy performance. Different markets or periods may require different parameter settings. Parameter optimization and sensitivity analysis are recommended.
-
Consecutive Stop Loss Risk: In high-volatility or sideways markets, the strategy may trigger consecutive stop losses, causing capital curve decline. Consider adding market environment filters to pause trading under unfavorable market conditions.
-
Calculation Complexity: RAHA indicator calculation is relatively complex and requires loop processing of data, which may cause slight delays in real-time trading. Calculation efficiency should be evaluated in high-frequency trading environments.
-
Position Risk: Although the strategy limits risk per trade, it doesn't consider overall position risk. Total risk may exceed expectations when multiple trades are open simultaneously. Adding overall risk control mechanisms is recommended.
-
Bollinger Band Anomaly Entry Risk: Entries based on positions above the Bollinger Band may enter too early in extreme market conditions. Consider adding additional filtering conditions, such as volume confirmation or auxiliary judgment from other technical indicators.
-
Fixed Multiple Take Profit Risk: The strategy uses a fixed 3x stop loss distance as profit target, which may not be flexible enough in different market environments. Consider dynamically adjusting profit targets based on market volatility or support/resistance levels.
5. Strategy Optimization Directions
Based on in-depth analysis of the strategy, here are possible optimization directions:
-
Adaptive Sensitivity Parameter: The strategy currently uses a fixed sensitivity parameter (1.5). Consider automatically adjusting sensitivity based on market volatility, using higher values in low-volatility markets to increase sensitivity, and lower values in high-volatility markets to improve stability.
-
Add Market Environment Filter: Introduce market environment judgment mechanisms, such as trend strength indicators (ADX) or volatility indicators (ATR), to reduce or avoid trading in market environments unsuitable for short-term strategies.
-
Optimize Exit Mechanism: Current strategy exits mainly based on technical indicator reversals and stop losses. Consider adding more flexible partial profit-locking mechanisms, such as moving stop loss to breakeven when reaching 1:1 risk-reward ratio, or setting multiple profit targets based on support/resistance levels.
-
Incorporate Volume Confirmation: Adding volume confirmation when entry signals generate can reduce false breakouts and signals. Volume confirmation is particularly important for special entry conditions above the Bollinger Band.
-
Time Filter: Analyzing strategy performance during different time periods may reveal that the strategy performs better during certain sessions (such as market opening or before closing). Adding time filters can improve overall strategy efficiency.
-
Add Fundamental Filters: For applications to stocks or certain commodities, consider adding fundamental filtering conditions, such as excluding periods before important data releases or periods affected by specific seasonal factors.
-
Machine Learning Optimization: Use machine learning methods to optimize strategy parameter combinations or enhance entry and exit decisions through historical pattern recognition. This can be achieved through deep analysis of historical data to discover patterns that traditional technical analysis might overlook.
-
Risk Balancing Mechanism: Add dynamic risk adjustment mechanisms based on account equity and open positions to ensure total risk doesn't exceed preset limits, especially in cases of consecutive entries.
6. Conclusion
The RAHA Quantitative Dynamic Weight Moving Average Short-Term Trend Strategy is an innovative quantitative trading system. Its core lies in using a unique moving average calculation method to process price data, assigning different weights to outliers, thereby creating a more sensitive yet stable moving average indicator. The strategy forms a complete trading decision system through collaborative judgment of multi-period RAHA indicators combined with auxiliary indicators like Bollinger Bands.
The strategy's greatest advantage lies in its adaptive risk management and dynamic stop loss adjustment mechanisms, allowing it to maintain stable risk control in different market environments. Meanwhile, multi-level trend confirmation and flexible exit mechanisms also enhance the strategy's robustness.
However, the strategy also faces challenges such as parameter sensitivity, trend reversal risk, and consecutive stop loss risk. Performance can be further improved through introducing adaptive parameters, market environment filters, optimizing exit mechanisms, and adding volume confirmation.
Overall, the RAHA Quantitative Dynamic Weight Moving Average Short-Term Trend Strategy demonstrates the potential of combining innovative technical indicators with traditional trading concepts. Through continuous optimization and adaptation to different market environments, this strategy has the potential to become a powerful tool for short-term traders, helping them achieve more stable returns in the market.
- 1