
Overview
The Multi-Timeframe SMA Trend Reversal Pullback Trading Strategy is a quantitative trading system based on Simple Moving Averages (SMA), combining four core elements: trend confirmation, moving average slope, price pullbacks, and volatility-based stop losses. This strategy monitors moving averages of different periods (9, 20, 50, 100, and 200) to identify pullback opportunities in strong trend environments and uses historical volatility to set precise stop-loss levels. The core concept is to wait for short-term retracements to key support or resistance levels after a major trend has been established, entering positions when price reconfirms the primary trend direction, while using volatility extremes for risk management.
Strategy Principles
The strategy operates on a multi-layered condition filtering system:
-
Trend Confirmation Conditions:
- Long trend requires price above both 20 and 200-day moving averages (trendUp)
- Short trend requires price below both 20 and 200-day moving averages (trendDown)
-
Moving Average Alignment Conditions:
- Long positions require 20-day SMA above 200-day SMA (smaOrderUp)
- Short positions require 20-day SMA below 200-day SMA (smaOrderDown)
-
Slope Conditions:
- Slopes are calculated by comparing current SMA values with values from 5 periods ago
- Long positions require positive slopes for both 20-day and 200-day SMAs (slopeUp)
- Short positions require negative slopes for both 20-day and 200-day SMAs (slopeDown)
-
Pullback Entry Conditions:
- Long entry requires previous period's price below 20-day SMA and current price moving back above it (pullbackUp)
- Short entry requires previous period's price above 20-day SMA and current price breaking below it (pullbackDown)
-
Stop Loss Settings:
- Long positions use the lowest point of the past 10 periods as stop loss (swingLow)
- Short positions use the highest point of the past 10 periods as stop loss (swingHigh)
When all respective conditions are met simultaneously, the strategy issues long or short signals and sets the corresponding stop-loss levels.
Strategy Advantages
-
Systematic Trend Filtering: Through multiple moving averages and slope conditions, the strategy effectively filters weak and ranging markets, trading only in strong trend environments, significantly improving signal quality.
-
Precise Entry Timing: The pullback conditions ensure low-risk entry points after trend confirmation, avoiding chasing highs or catching falling knives, improving the risk-reward ratio for each trade.
-
Dynamic Stop-Loss Mechanism: Setting stop losses based on actual market volatility adapts better to different market conditions and volatility environments than fixed-point stops.
-
Multiple Confirmation Mechanisms: By combining multiple conditions such as moving average crossovers, price position, and slope direction, the probability of false signals is reduced.
-
Easy to Understand and Optimize: The strategy logic is clear and intuitive, with few parameters each having a specific purpose, making it easy to optimize for different market characteristics.
Strategy Risks
-
Moving Average Lag Issues: Moving averages are inherently lagging indicators and may cause delayed signals in volatile markets, missing optimal entry points or resulting in delayed stops. Consider incorporating more sensitive indicators like EMAs or VWMAs as supplements.
-
Pullback Depth Uncertainty: The strategy cannot predict pullback depth; sometimes price may resume the trend before reaching the 20-day SMA, causing missed trading opportunities. Consider adding ATR-based dynamic zone assessments rather than single price lines.
-
Consecutive Stop-Loss Risk: In oscillating markets, frequent price crossovers of moving averages can lead to consecutive stop losses. Adding a volatility filter to adjust strategy parameters or pause trading in high-volatility environments is recommended.
-
Parameter Sensitivity: The strategy is relatively sensitive to moving average periods and lookback parameters, with different markets and timeframes potentially requiring different parameters. Backtesting is recommended to determine the most suitable parameter combinations for specific trading instruments.
-
Lack of Volume Confirmation: The current strategy is based solely on price data; the absence of volume confirmation may lead to false signals in low-liquidity environments. Consider adding volume conditions as additional filters.
Strategy Optimization Directions
-
Adaptive Parameter Adjustment: Consider automatically adjusting moving average periods and slope lookback periods based on market volatility, maintaining optimal performance across different market environments. For example, using shorter moving average periods in low-volatility markets and longer periods in high-volatility markets.
-
Additional Filtering Conditions: Introduce Relative Strength Index (RSI) or Stochastic indicators as auxiliary filters, confirming pullback signals only in overbought/oversold regions, further reducing false signals.
-
Dynamic Position Sizing: Adjust position size based on volatility and trend strength, increasing positions in strong-trend, low-volatility environments and reducing positions in weak-trend, high-volatility environments to optimize capital efficiency.
-
Multi-Timeframe Confirmation: Incorporate trend confirmation mechanisms from higher timeframes, ensuring trade direction aligns with larger trends, reducing counter-trend trading risks.
-
Profit Target Setting: The current strategy only has stop-loss settings without profit targets. Consider setting dynamic profit targets based on ATR or key resistance/support levels to optimize risk-reward ratios.
-
Market State Classification: Introduce market state assessment (trending, ranging, breakout) and use different parameter settings or trading logic for different market states.
Summary
The Multi-Timeframe SMA Trend Reversal Pullback Trading Strategy is a structurally complete and logically clear quantitative trading system that effectively captures low-risk entry opportunities in trending markets through multiple moving average combinations, slope analysis, and price pullback conditions. This strategy is particularly suitable for markets with clear medium to long-term trends, controlling risk through dynamic stop-loss mechanisms, providing traders with a systematic trend-following method.
While inherent risks exist, such as moving average lag and parameter sensitivity, through the suggested optimization directions like adaptive parameters, multiple filtering conditions, and dynamic position management, the strategy's stability and adaptability can be further enhanced. Ultimately, this strategy provides quantitative traders with a reliable foundation framework that can be customized according to individual risk preferences and market characteristics.
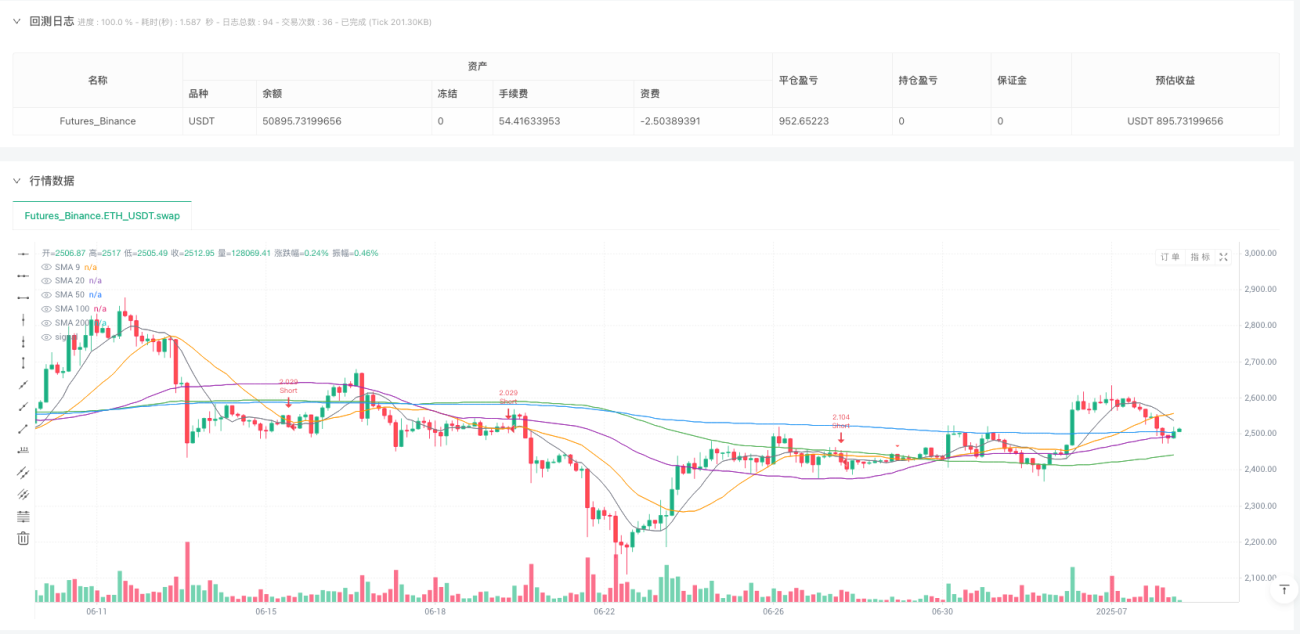
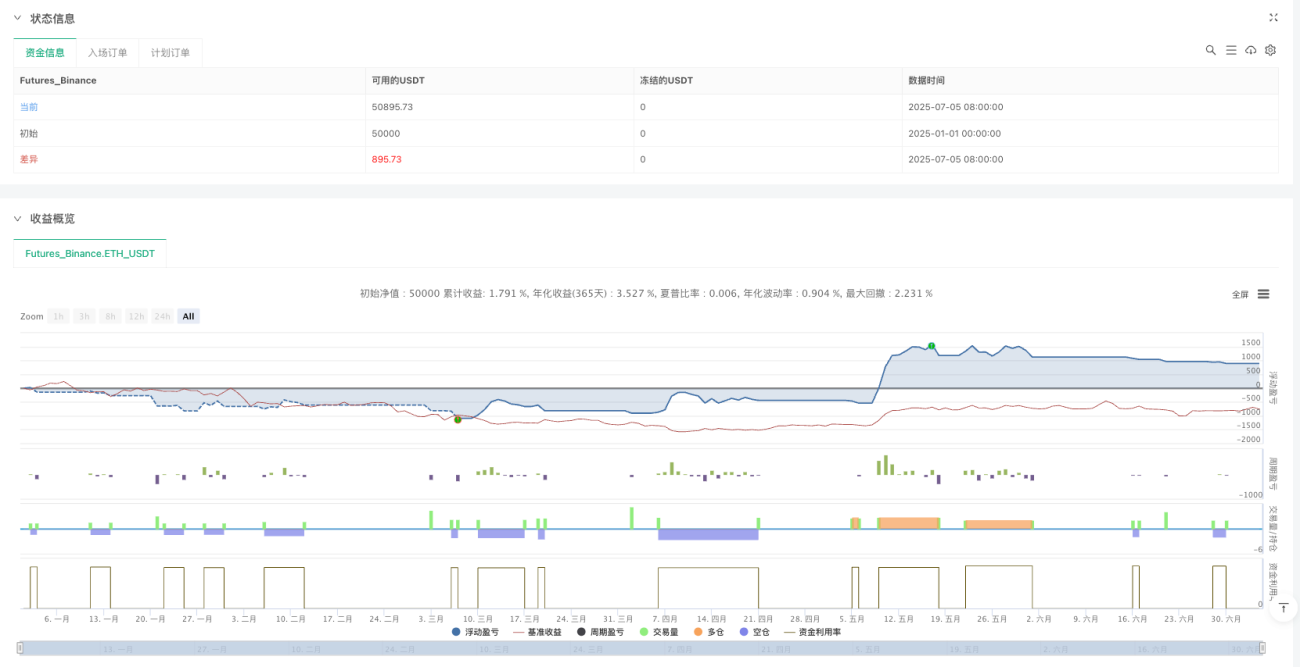
/*backtest
start: 2025-01-01 00:00:00
end: 2025-07-05 10:00:00
period: 3h
basePeriod: 3h
exchanges: [{"eid":"Futures_Binance","currency":"ETH_USDT"}]
*/

//@version=5
strategy("SMA Pullback Strategy with Swing SL", overlay=true, default_qty_type=strategy.percent_of_equity, default_qty_value=10)

// === SMA Definitions ===- 1