High-Precision ATR Trailing Stop Breakout Strategy with ADX Directional Filtering System

ATR ADX RMA 突破交易 趋势跟踪 动态止损 回撤止盈 方向过滤 自适应风险管理
Created on: 2025-07-08 13:53:49 Modified on: 2025-07-08 13:53:49
Copy: 1 Number of hits: 284
avatar of ianzeng123 ianzeng123
2
Follow
319
Followers

 High-Precision ATR Trailing Stop Breakout Strategy with ADX Directional Filtering System  High-Precision ATR Trailing Stop Breakout Strategy with ADX Directional Filtering System

Overview

This strategy is a meticulously designed breakout trading system that combines ATR (Average True Range) adaptive stop loss management with ADX (Average Directional Index) directional filtering. The strategy enters trades after confirmed breakouts above/below N-period highs/lows, while aligning with the main trend determined by a long-term RMA (Rolling Moving Average) trend filter. The system employs a dual-phase stop loss logic: initial fixed ATR stops and dynamic trailing stops activated after reaching profit thresholds, alongside a pullback-based profit-taking mechanism to secure gains during high volatility periods.

Strategy Principles

The core principles of this strategy are based on a comprehensive judgment system that combines price breakouts of historical support/resistance levels with trend confirmation and directional strength filtering:

  1. Breakout Signal Generation: Uses N-period (default 96) highs/lows as breakout reference points. A long signal is triggered when price closes above the previous high and is in an uptrend; a short signal is triggered when price closes below the previous low and is in a downtrend.

  2. Trend Filtering: Employs a longer-period (default 960) RMA line as the basis for trend determination. Price above the RMA indicates an uptrend, while price below the RMA indicates a downtrend, ensuring trade direction aligns with the main trend.

  3. ADX Directional Strength Filtering: Calculates the current market’s directional strength (ADX indicator) and requires ADX to be greater than a set threshold (default 12) and in an ascending phase, filtering out ranging market environments with unclear direction.

  4. Dual-Phase Stop Loss Mechanism:

    • First phase: Sets initial stop loss position using an ATR multiplier (default 1.0) after entry
    • Second phase: Activates trailing stop when profit reaches an ATR multiplier (default 3.0), using a larger ATR multiplier (default 9.0) for dynamic stop positioning
  5. Pullback Profit-Taking Mechanism: After trailing stop activation, records the highest price for longs/lowest price for shorts. When price retraces from the extreme point by more than the set ATR multiple (default 13x for longs, 4x for shorts), profit-taking exit is triggered.

Strategy Advantages

  1. Adaptive Risk Management: Dynamically adjusts stop loss positions through the ATR indicator, enabling effective risk control in various volatility environments. As a volatility indicator, ATR automatically adjusts stop distance based on actual market fluctuations, avoiding the problems of fixed-point stops being too wide or too narrow under different market conditions.

  2. Multi-Layered Risk Control: The strategy combines initial stops with trailing stops in a dual-layer stop loss logic, ensuring both controllable initial risk and profit locking after gains expand, while giving trends sufficient room to develop. This stop structure is particularly suitable for capturing major trend movements.

  3. Directional Confirmation Filtering: Through ADX indicator filtering, requiring the market to have sufficient directionality and strengthening direction (ADX > threshold and ADX > ADX[1]), effectively avoids frequent trading in ranging markets with no clear trend, reducing losses from false breakouts.

  4. Trend Consistency Assurance: Uses long-period RMA line as a trend filter to ensure trading only in the direction of the main trend, avoiding counter-trend operations, improving trade success rate and capital efficiency.

  5. Intelligent Profit-Taking Mechanism: Through the pullback profit-taking function, secures profits when price corrections occur after significant fluctuations, preventing excessive profit retracement, particularly suitable for capturing markets with suddenly expanding volatility.

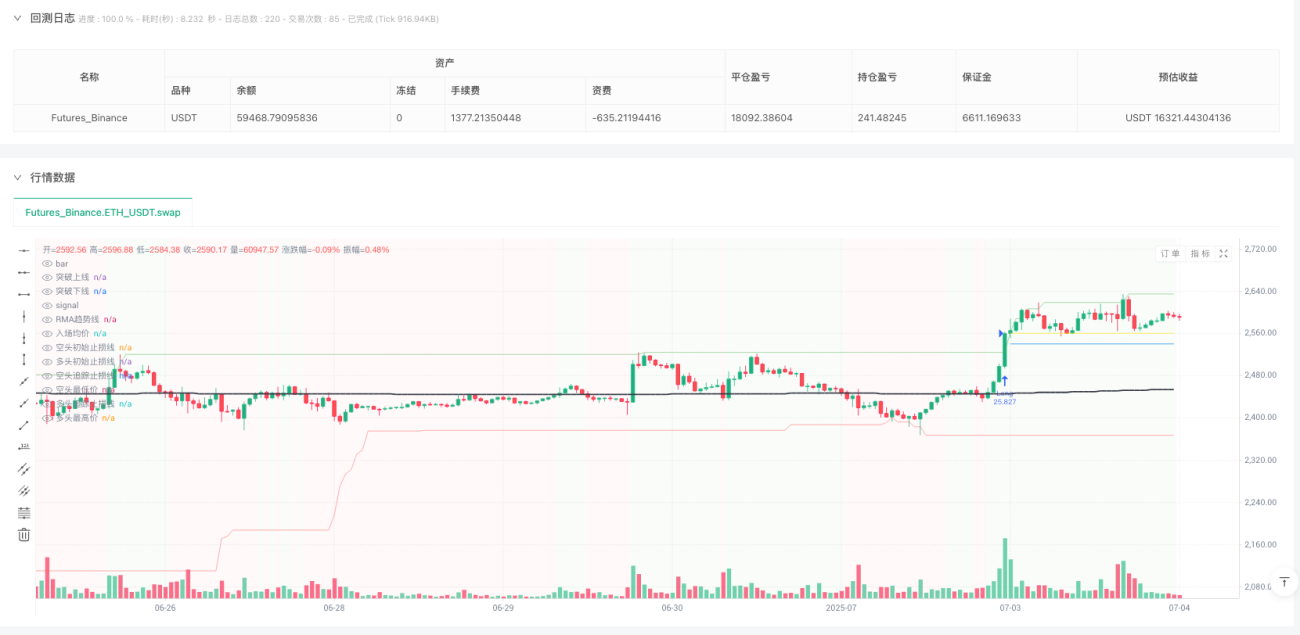
  6. Visualization Monitoring: The strategy clearly identifies entry prices, various stop lines, breakout levels, and trend background colors on the chart, allowing traders to intuitively monitor strategy operating status and key price levels.

Strategy Risks

  1. False Breakout Risk: Despite using ADX filtering and trend confirmation, false breakouts may still occur, especially during important news releases or sudden liquidity changes. The solution is to appropriately increase the ADX threshold or add breakout confirmation requirements, such as requiring price to maintain above/below the breakout level for multiple candlesticks.

  2. Parameter Sensitivity: Strategy performance is relatively sensitive to parameter settings, especially the selection of ATR period, multipliers, and breakout period. Optimal parameters may vary significantly across different market environments. It is recommended to validate parameter stability through historical backtesting in different market environments and consider implementing adaptive parameter adjustment mechanisms.

  3. Trailing Stop Lag: During violent market reversals, trailing stops may not keep up with price changes in a timely manner, resulting in partial giveback of profits. Consider dynamically adjusting ATR multipliers in high-volatility environments or incorporating short-term momentum indicators to provide early warning of potential trend reversals.

  4. Long-Period Trend Filter Lag: Using a long-period RMA line as a trend filter may cause missed or false signals near trend turning points. The solution is to introduce multi-period trend confirmation or combine more sensitive medium and short-term trend indicators as auxiliary judgments.

  5. Premature Exit from Pullback Profit-Taking: In strong trends, the pullback profit-taking mechanism may cause premature exits from trends that would continue to develop. Consider dynamically adjusting the pullback threshold based on trend strength or adaptively adjusting the pullback multiplier according to volatility changes.

Optimization Directions

  1. Adaptive Parameter System: Construct an adaptive parameter adjustment mechanism based on market volatility and trend strength, allowing ATR multipliers, ADX thresholds, and pullback multiples to automatically optimize according to the current market environment. For example, reduce ATR multipliers in low-volatility environments and increase them in high-volatility environments; increase pullback multiples in strong trends and decrease them in weak trends.

  2. Multi-Timeframe Confirmation: Introduce multi-timeframe analysis, requiring the trend direction of higher timeframes to be consistent with the trading direction, and incorporating support and resistance levels from higher timeframes into decision-making references to improve the reliability of breakout signals.

  3. Smart Entry Optimization: Implement a phased entry mechanism, partially entering after the initial breakout signal is triggered and adding positions after the breakout receives further confirmation, reducing risks from false breakouts while ensuring genuine breakout opportunities are not missed.

  4. Volatility-Aware Profit-Taking: Develop an intelligent profit-taking system based on volatility changes, setting stricter pullback profit-taking conditions after sudden volatility expansion and allowing more retracement room when volatility stabilizes, making profit-taking decisions more aligned with actual market conditions.

  5. Machine Learning Enhancement: Introduce machine learning algorithms to analyze historical breakout patterns, identify feature combinations of high-success-rate breakouts, and dynamically adjust strategy parameters or set up a breakout quality scoring system accordingly, prioritizing high-quality breakout signals for trading.

  6. Transaction Cost Optimization: Optimize entry timing and order types based on liquidity characteristics and transaction cost structures of different trading instruments, such as using limit orders instead of market orders in low-liquidity environments, or employing trailing limit orders in high-volatility environments for entry.

  7. Sentiment Indicator Integration: Incorporate market sentiment indicators (such as volatility indices, market breadth indicators, etc.) as auxiliary decision-making references, adjusting strategy parameters or pausing trading in extreme sentiment environments to avoid unnecessary losses in irrational market conditions.

Summary

The High-Precision ATR Trailing Stop Breakout Strategy with ADX Directional Filtering System is a comprehensive trading system that combines multiple core concepts of technical analysis. It captures trend starting points through breakout trading, improves signal quality through trend filtering and directional strength confirmation, and implements comprehensive fund management through adaptive risk management and multi-layered stop loss and profit-taking mechanisms.

The strategy’s greatest advantage lies in its adaptability to different market environments and its comprehensive risk management framework. The dynamic risk adjustment implemented through the ATR indicator enables the strategy to maintain relatively consistent risk exposure levels in different volatility environments, while the dual-phase stop loss and pullback profit-taking mechanisms provide a balanced solution that protects capital while maximizing profits.

Although the strategy has certain risks in terms of parameter sensitivity and stop loss lag, these risks can be effectively controlled through the suggested optimization directions, especially the adaptive parameter system and multi-timeframe confirmation. Further introduction of machine learning and sentiment indicator analysis promises to significantly enhance the strategy’s robustness and long-term profit potential.

For quantitative traders, this strategy provides a solid framework that can be flexibly adjusted and extended according to personal risk preferences and market views, making it a trading system with both theoretical depth and practical value.

Strategy source code
/*backtest
start: 2024-07-08 00:00:00
end: 2025-07-04 08:00:00
period: 1h
basePeriod: 1h
exchanges: [{"eid":"Futures_Binance","currency":"ETH_USDT"}]
*/

//@version=6
strategy('YTPBTC1HATRSSADX', 
         overlay=true, 
         initial_capital=10000, 
         commission_value=0.1, 
         default_qty_value=100, 
         default_qty_type=strategy.percent_of_equity, 
         margin_long=10, 
         margin_short=10, 
         pyramiding=1)

// ==================== 输入参数 ====================
atr_length = input.int(48, 'ATR周期', minval=1, step=12)
atr_mult_1 = input.float(1.0, 'ATR初始止损乘数', minval=0.1, step=0.1)
atr_mult_2 = input.float(9.0, 'ATR追踪止损乘数', minval=0.1)

// 追踪激活倍数
profit_atr_mult = input.float(3.0, 'ATR追踪激活倍数', minval=0.5, step=0.5)

// 固定回撤止盈设置
long_pullback_atr = input.float(13, '多头回撤止盈倍数', minval=0, step=1)
short_pullback_atr = input.float(4, '空头回撤止盈倍数', minval=0, step=1)

breakout_period = input.int(96, title='突破周期', minval=1, step=24)
rma_length = input.int(500, 'RMA趋势过滤周期', minval=1, step=96)

// ADX设置
enable_adx_filter = input.bool(true, '启用ADX过滤')
adx_length = atr_length//input.int(48, 'ADX周期', minval=1, step=12)
adx_threshold = input.float(12, "ADX阈值", minval=1)

use_breakeven = true  // 启动追踪时是否先保本止损

// ==================== ATR计算 ====================
atr_value = ta.atr(atr_length)

// ==================== ADX指标计算 ====================
// 真实波幅计算
tr = math.max(math.max(high - low, math.abs(high - nz(close[1]))),
              math.abs(low - nz(close[1])))

// 方向性移动计算
dm_plus = high - nz(high[1]) > nz(low[1]) - low ? math.max(high - nz(high[1]), 0) : 0
dm_minus = nz(low[1]) - low > high - nz(high[1]) ? math.max(nz(low[1]) - low, 0) : 0

// ADX计算
var float sm_tr = na
var float sm_dm_plus = na
var float sm_dm_minus = na

sm_tr := nz(sm_tr[1]) - nz(sm_tr[1]) / adx_length + tr
sm_dm_plus := nz(sm_dm_plus[1]) - nz(sm_dm_plus[1]) / adx_length + dm_plus
sm_dm_minus := nz(sm_dm_minus[1]) - nz(sm_dm_minus[1]) / adx_length + dm_minus

di_plus = sm_dm_plus / sm_tr * 100
di_minus = sm_dm_minus / sm_tr * 100
dx = math.abs(di_plus - di_minus) / (di_plus + di_minus) * 100
adx = ta.sma(dx, adx_length)

// ==================== 趋势过滤 ====================
rma_trend = ta.rma(close, rma_length)
plot(rma_trend, title='RMA趋势线', color=color.black, linewidth=2)

trend_long = close > rma_trend
trend_short = close < rma_trend

// ==================== 突破信号 ====================
// 获取过去N根K线的最高高点和最低低点(避免未来数据)
highest_high = ta.highest(high, breakout_period)[1]
lowest_low = ta.lowest(low, breakout_period)[1]

// 入场条件 - 修改ADX条件,要求ADX上升
adx_condition = not enable_adx_filter or (adx >= adx_threshold and adx > adx[1])
long_condition = close > highest_high and trend_long and strategy.position_size == 0 and adx_condition
short_condition = close < lowest_low and trend_short and strategy.position_size == 0 and adx_condition

// ==================== 入场执行 ====================
if long_condition
    strategy.entry('Long', strategy.long)

if short_condition
    strategy.entry('Short', strategy.short)

// ==================== ATR止损系统 ====================
// 止损状态变量
var float long_stop_initial = na  // 第一段初始止损
var float long_stop_trail = na    // 第二段追踪止损
var bool long_trail_active = false
var float short_stop_initial = na  // 第一段初始止损
var float short_stop_trail = na    // 第二段追踪止损
var bool short_trail_active = false

// 回撤止盈变量
var float long_highest = na      // 多头最高价记录
var float short_lowest = na      // 空头最低价记录

// ==================== 多头止损计算 ====================
if strategy.position_size > 0
    // 新开多头仓位
    if strategy.position_size[1] <= 0
        long_stop_initial := strategy.position_avg_price - atr_value * atr_mult_1
        long_stop_trail := na
        long_trail_active := false
        long_highest := na  // 重置最高价记录
    else
        // 计算当前浮动盈亏
        float current_profit = close - strategy.position_avg_price
        
        // 检查是否激活追踪止损
        if not long_trail_active and current_profit >= atr_value * profit_atr_mult
            long_trail_active := true
            long_highest := high  // 开始记录最高价
            
            // 保本处理
            if use_breakeven
                long_stop_trail := strategy.position_avg_price
            else
                long_stop_trail := close - atr_value * atr_mult_2
        
        // 更新追踪止损和最高价记录
        if long_trail_active
            // 更新最高价记录
            long_highest := math.max(long_highest, high)
            
            // 传统追踪止损更新
            float new_stop = close - atr_value * atr_mult_2
            long_stop_trail := math.max(long_stop_trail, new_stop)

// ==================== 空头止损计算 ====================
if strategy.position_size < 0
    // 新开空头仓位
    if strategy.position_size[1] >= 0
        short_stop_initial := strategy.position_avg_price + atr_value * atr_mult_1
        short_stop_trail := na
        short_trail_active := false
        short_lowest := na  // 重置最低价记录
    else
        // 计算当前浮动盈亏
        float current_profit = strategy.position_avg_price - close
        
        // 检查是否激活追踪止损
        if not short_trail_active and current_profit >= atr_value * profit_atr_mult
            short_trail_active := true
            short_lowest := low  // 开始记录最低价
            
            // 保本处理
            if use_breakeven
                short_stop_trail := strategy.position_avg_price
            else
                short_stop_trail := close + atr_value * atr_mult_2
        
        // 更新追踪止损和最低价记录
        if short_trail_active
            // 更新最低价记录
            short_lowest := math.min(short_lowest, low)
            
            // 传统追踪止损更新
            float new_stop = close + atr_value * atr_mult_2
            short_stop_trail := math.min(short_stop_trail, new_stop)

// ==================== 止损执行 ====================
// 第一段止损:收盘价止损(未激活追踪时)
if strategy.position_size > 0 and not long_trail_active
    // 检查收盘价是否触及初始止损线
    if close <= long_stop_initial
        strategy.close('Long', comment='初始止损')

if strategy.position_size < 0 and not short_trail_active
    // 检查收盘价是否触及初始止损线
    if close >= short_stop_initial
        strategy.close('Short', comment='初始止损')

// 第二段止损:实时止损(激活追踪后)
if strategy.position_size > 0 and long_trail_active
    strategy.exit('Long Trail Stop', from_entry='Long', stop=long_stop_trail)

if strategy.position_size < 0 and short_trail_active  
    strategy.exit('Short Trail Stop', from_entry='Short', stop=short_stop_trail)

// 动态回撤止盈检查
if strategy.position_size > 0 and long_trail_active and not na(long_highest)
    // 计算从最高点回撤幅度
    pullback_amount = long_highest - close
    pullback_threshold = atr_value * long_pullback_atr
    if pullback_amount >= pullback_threshold
        strategy.close('Long', comment='回撤止盈')

if strategy.position_size < 0 and short_trail_active and not na(short_lowest)
    // 计算从最低点反弹幅度  
    pullback_amount = close - short_lowest
    pullback_threshold = atr_value * short_pullback_atr
    if pullback_amount >= pullback_threshold
        strategy.close('Short', comment='回撤止盈')

// ==================== 变量重置 ====================
if strategy.position_size[1] != 0 and strategy.position_size == 0
    long_stop_initial := na
    long_stop_trail := na
    long_trail_active := false
    short_stop_initial := na
    short_stop_trail := na
    short_trail_active := false
    // 重置回撤止盈变量
    long_highest := na
    short_lowest := na

// ==================== 图表绘制 ====================
plot(strategy.position_avg_price, color=color.new(color.yellow, 44), title="入场均价", linewidth=1)
plot(long_stop_initial, color=color.new(color.blue, 44), title='多头初始止损线', linewidth=1)
plot(short_stop_initial, color=color.new(color.blue, 44), title='空头初始止损线', linewidth=1)
plot(long_stop_trail, color=color.new(color.fuchsia, 44), title='多头追踪止损线', linewidth=1)
plot(short_stop_trail, color=color.new(color.fuchsia, 44), title='空头追踪止损线', linewidth=1)

// 最高/最低价记录线
plot(long_highest, color=color.new(color.green, 70), title='多头最高价', linewidth=1, style=plot.style_stepline)
plot(short_lowest, color=color.new(color.red, 70), title='空头最低价', linewidth=1, style=plot.style_stepline)

// 绘制突破线
plot(highest_high, color=color.new(color.green, 70), title='突破上线')
plot(lowest_low, color=color.new(color.red, 70), title='突破下线')

// 背景颜色显示趋势
bgcolor(trend_long ? color.new(color.green, 95) : trend_short ? color.new(color.red, 95) : na, title="趋势背景")

// ==================== 信息显示 ====================
// 在图表上显示当前策略信息
base_rows = enable_adx_filter ? 3 : 2
var table info_table = table.new(position.top_right, 2, base_rows, bgcolor=color.white, border_width=1)

var int row_index = 0
row_index := 0  // 重置行索引

table.cell(info_table, 0, row_index, "ATR周期", text_color=color.black, text_size=size.small)
table.cell(info_table, 1, row_index, str.tostring(atr_length), text_color=color.black, text_size=size.small)
row_index := row_index + 1

// 只在启用ADX时显示
if enable_adx_filter
    table.cell(info_table, 0, row_index, "ADX", text_color=color.black, text_size=size.small)
    table.cell(info_table, 1, row_index, str.tostring(math.round(adx, 1)), text_color=color.black, text_size=size.small)
    row_index := row_index + 1

table.cell(info_table, 0, row_index, "追踪倍数", text_color=color.black, text_size=size.small)
table.cell(info_table, 1, row_index, str.tostring(profit_atr_mult), text_color=color.black, text_size=size.small)