
Strategy Overview
This strategy is a quantitative trading approach based on the Simple Moving Average (SMA) crossover, which identifies market trend reversal points through the intersection of fast and slow moving averages, combined with a fixed percentage take-profit and stop-loss mechanism for risk and reward management. The core logic is straightforward: when the fast moving average crosses above the slow moving average, a buy signal is generated, indicating a potential uptrend; when the fast moving average crosses below the slow moving average, a sell signal is generated, indicating a potential downtrend. Additionally, each trade is protected by predefined take-profit and stop-loss levels based on the entry price, safeguarding capital and securing profits.
Strategy Principles
The technical foundation of this strategy relies on the characteristics of moving averages as trend indicators. The implementation details are as follows:
- Dual SMA System: The strategy employs two simple moving averages with different periods, by default 10 periods (fast line) and 30 periods (slow line).
- Signal Generation Logic:
- Buy Signal: When the fast SMA crosses above the slow SMA (determined using the
ta.crossoverfunction) - Sell Signal: When the fast SMA crosses below the slow SMA (determined using the
ta.crossunderfunction)
- Buy Signal: When the fast SMA crosses above the slow SMA (determined using the
- Trade Execution Mechanism:
- Upon a buy signal, a long position is entered
- Upon a sell signal, a short position is entered
- Risk Management System:
- Take-Profit Setting: A fixed percentage (default 0.10%) of the entry price sets the profit target
- Stop-Loss Setting: A fixed percentage (default 0.10%) of the entry price sets the maximum loss limit
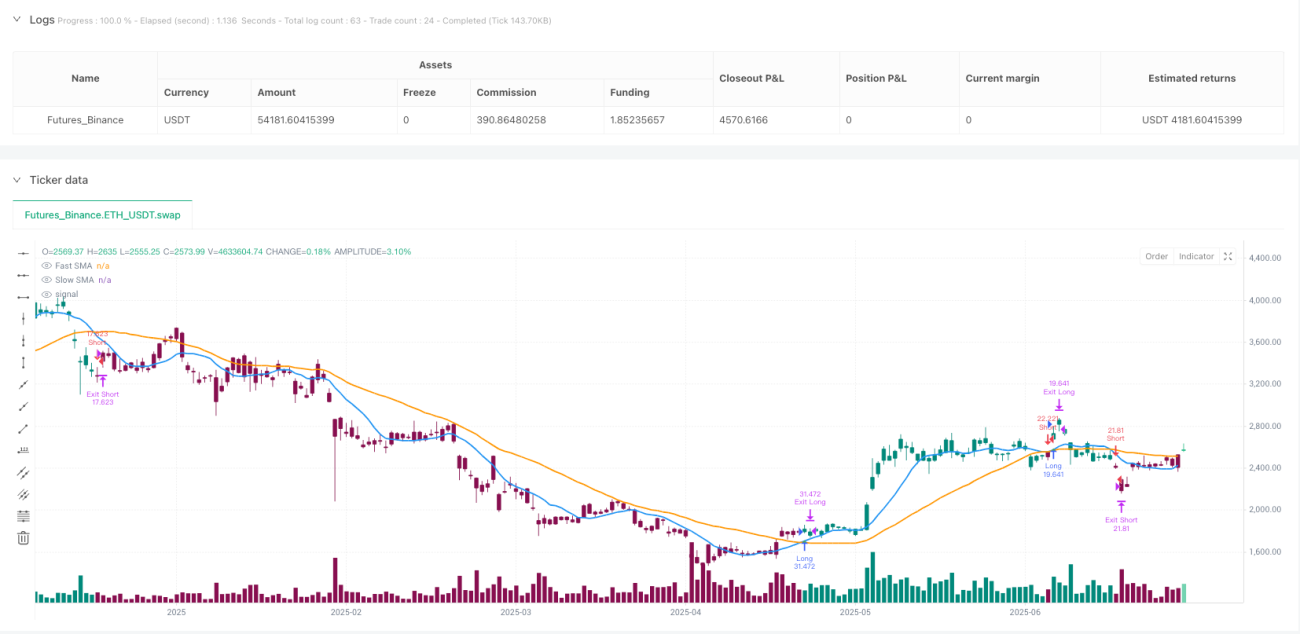
- Visualization Components:
- Dual SMA Display: Different colors (blue and orange) and line widths identify the fast and slow averages
- Signal Markers: Long and short signals are marked with different shapes and colored arrows
- Bar Coloring: Price bars are colored based on the current trend direction
From the code implementation, this strategy uses TradingView Pine Script version 6, utilizing the strategy function family for trading logic, plot and plotshape functions for visualization, and sets up alertcondition for trade notifications.
Strategy Advantages
Analyzing the code implementation, the following significant advantages can be identified:
- Simplicity and Efficiency: The strategy logic is clear and easy to understand and implement, without complex calculations, resulting in high computational efficiency.
- Strong Adaptability: The dual SMA system can adapt to different market environments and timeframes, with adjustable parameters.
- Comprehensive Risk Control: Integrated take-profit and stop-loss mechanisms set clear exit conditions for each trade, effectively controlling single-trade risk.
- Multi-Market Applicability: The code structure is applicable to various trading instruments, including stocks, cryptocurrencies, forex, and indices.
- High Visualization: Provides clear visual feedback, including moving average trends, entry signal markers, and bar color changes, allowing traders to intuitively understand market conditions.
- Flexible Capital Management: Uses a percentage of equity model for position sizing, defaulting to 100% of funds, but adjustable as needed.
- Full Automation: The strategy can be executed completely automatically, reducing human intervention and emotional factors.
- Real-time Alert Functionality: Built-in trade signal alert conditions help traders seize market opportunities promptly.
Strategy Risks
Despite its reasonable design, the strategy still has the following potential risks and limitations:
- False Signals in Ranging Markets: In sideways or oscillating markets, the dual SMA system may generate frequent crossover signals, leading to consecutive stop-losses. The solution is to add filtering conditions, such as trend confirmation indicators or volume confirmation.
- Lagging Issue: As lagging indicators, moving averages typically respond slowly at trend reversal points, potentially missing ideal entry points or delaying exits. Consider combining leading indicators or shortening the moving average periods to mitigate this problem.
- Inflexible Fixed Percentage Risk Settings: The current take-profit and stop-loss settings use fixed percentages, not accounting for differences in market volatility. An improvement direction is to introduce dynamic stop-loss mechanisms based on ATR or volatility.
- Lack of Drawdown Control: The strategy does not set maximum drawdown limits or overall risk control mechanisms. Adding maximum loss limits or consecutive loss number limits is recommended.
- Parameter Sensitivity: The dual SMA period settings significantly impact strategy performance, and different markets and timeframes may require different parameters. Thorough parameter optimization and backtesting are necessary.
- Overtrading Risk: Under certain market conditions, the strategy may trigger excessive trades, increasing transaction costs. Trading frequency can be controlled by adding trade filters or cooling periods.
- Transaction Costs Not Considered: The code does not explicitly incorporate the impact of trading fees and slippage, potentially leading to overly optimistic backtest results. These factors should be taken into account in practical applications.
Strategy Optimization Directions
Based on code analysis, the strategy can be optimized in the following directions:
- Dynamic Take-Profit/Stop-Loss: Replace fixed percentage take-profit and stop-loss with dynamic mechanisms based on ATR or historical volatility to adapt to volatility changes in different market conditions. This is important because fixed percentages may perform inconsistently in high and low volatility markets.
- Trend Strength Filtering: Introduce ADX or similar indicators to measure trend strength, executing trades only when trends are clear, reducing false signals in oscillating markets. This can effectively improve the strategy's win rate.
- Volume Confirmation: Add volume conditions as auxiliary confirmation for crossover signals to improve signal reliability. Volume is often important evidence of trend authenticity.
- Parameter Adaptive Mechanism: Develop a mechanism to automatically adjust moving average periods based on market conditions, improving strategy adaptability. For example, longer moving average periods may be needed in high-volatility markets.
- Re-entry Logic: Design re-entry logic for when stop-loss is triggered but the trend signal remains valid, to capture continuous trends.
- Enhanced Risk Management: Add daily maximum loss limits, consecutive loss number limits, and other risk control mechanisms to protect account funds.
- Time Filters: Add time filters for specific markets to avoid trading during low liquidity or high volatility periods.
- Multi-Timeframe Analysis: Integrate trend directions from higher timeframes as trading filter conditions, only trading when trends across multiple timeframes are consistent.
- Optimized Position Sizing: Dynamically adjust the percentage of funds for each trade based on signal strength, market volatility, or historical win rates, rather than using a fixed 100% of funds.
- Add Smoothing Algorithms: Consider using EMA instead of SMA, or smoothing crossover signals to reduce erroneous trading signals.
These optimization directions primarily target improving signal quality, enhancing risk management, and increasing strategy adaptability, and can be selectively implemented based on actual trading needs.
Conclusion
The Dual SMA Crossover Trend-Following Quantitative Strategy with Risk Management is a trading system that combines classical technical analysis theory with modern risk management. The strategy monitors the relationship between fast and slow moving averages to determine market trends, generates trading signals at key crossover points, and sets predetermined profit targets and loss limits for each trade.
The main advantages of the strategy lie in its clear logic, ease of understanding and implementation, good visualization effects, and risk control mechanisms. However, as a system based on moving averages, it also faces typical challenges such as signal lag and frequent false signals in oscillating markets.
By introducing dynamic stop-loss mechanisms, trend strength filtering, multi-timeframe analysis, and other optimization measures, the performance and adaptability of the strategy can be significantly enhanced. For traders, understanding the operating principles and limitations of the strategy, and making appropriate adjustments based on personal risk preferences, are key to successfully applying this strategy.
Finally, it should be emphasized that any trading strategy needs thorough historical backtesting and forward validation before actual application, and should be specifically adjusted according to the characteristics of different market environments and trading instruments.
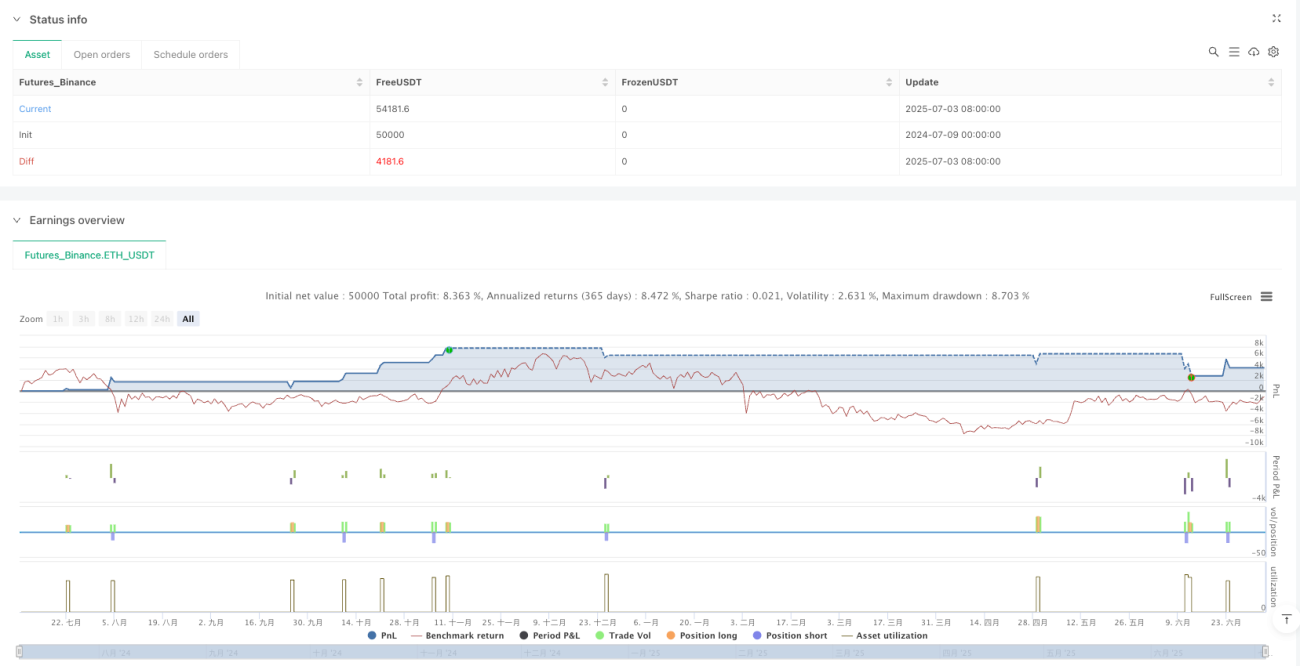
/*backtest
start: 2024-07-09 00:00:00
end: 2025-07-04 08:00:00
period: 1d
basePeriod: 1d
exchanges: [{"eid":"Futures_Binance","currency":"ETH_USDT"}]
*/

//@version=6
strategy("SMA Crossover Strategy with TP/SL", overlay=true, initial_capital=10000, default_qty_type=strategy.percent_of_equity, default_qty_value=100)

// --- Inputs ---- 1