
Overview
The Bollinger Bands Mean Reversion Trading Strategy is a quantitative trading approach based on price volatility and mean reversion principles. This strategy utilizes the Bollinger Bands indicator to identify oversold market areas and enters long positions when prices begin reverting to the mean. The core concept is to capture price movements as they bounce from the lower Bollinger Band back to the middle band (20-period moving average), providing relatively reliable short-term profit opportunities.
Strategy Principles
The fundamental principle of this strategy is built on mean reversion theory and the application of Bollinger Bands. Bollinger Bands consist of three lines: the middle band (20-period simple moving average), the upper band (middle band plus two standard deviations), and the lower band (middle band minus two standard deviations). The specific execution logic is as follows:
-
Entry Conditions:
- Candle 1: Closes below the lower Bollinger Band
- Candle 2: Closes above the lower Bollinger Band
- When these conditions are met, a buy stop order is placed at the high of Candle 2
-
Take Profit Setting:
- Full position is closed (100% profit target) when price reaches the 20-period moving average (middle Bollinger Band)
-
Stop Loss Setting:
- Stop loss is placed at the lower of the two lows between Candle 1 and Candle 2
This strategy's entry signal represents a market that may be oversold and beginning to rebound, while the take profit setting at the middle band embodies the mean reversion concept.
Strategy Advantages
-
Clear Entry and Exit Conditions: The strategy provides precise entry conditions (specific performance of two candles) and a clear profit target (20-period moving average), reducing subjective judgment during trading.
-
Based on Statistical Principles: Bollinger Bands are calculated using standard deviation, providing a statistical foundation. When prices deviate significantly from the mean, there is a higher probability they will revert.
-
Reasonable Risk Control: Stop loss is set at the lowest point of the entry signal candles, limiting the maximum loss per trade.
-
Clear Money Management: The strategy uses a percentage of total account equity (100%) for position sizing, facilitating risk assessment.
-
Visual Support: The code includes visualization of Bollinger Bands and entry signals, allowing traders to intuitively understand market conditions and signal trigger points.
-
Avoids Consecutive Poor Trades: The strategy has restrictions that only consider new entry signals when no positions are open.
Strategy Risks
-
Oscillating Market Risk: In sideways, choppy markets, prices may fluctuate between the lower and middle Bollinger Bands multiple times, leading to frequent trading with poor results.
-
Trending Market Risk: In strong downtrends, prices may continue to fall after a brief rebound, breaking through previous lows and triggering stop losses.
-
High Fund Utilization: The strategy uses 100% of account funds for trading. This high leverage approach can lead to rapid account depletion during consecutive losses.
-
False Breakout Risk: Sometimes prices may briefly break through the lower Bollinger Band and then quickly retreat, creating false entry signals.
-
Lack of Market Environment Filtering: The strategy does not consider the overall market environment (such as trend direction or volatility) to filter signals, potentially generating trade signals under unfavorable market conditions.
Strategy Optimization Directions
-
Introduce Trend Filters: Add longer-period moving averages or other trend indicators to only execute long signals in uptrends or neutral trend environments, avoiding trading in downtrends.
-
Optimize Money Management: Adjust the trading volume from a fixed 100% to a dynamic proportion based on market volatility or account drawdown status to reduce risk.
-
Implement Multiple Timeframe Analysis: Confirm market direction on larger timeframes, then execute trade signals on smaller timeframes to improve win rates.
-
Add Trading Filter Conditions: Include additional conditions such as volume confirmation or RSI oversold confirmation to reduce false signals.
-
Introduce Partial Profit Mechanisms: Set multiple profit targets, such as closing only part of the position when reaching the Bollinger middle line, allowing the remaining position to continue gaining.
-
Dynamic Stop Loss Adjustment: Implement trailing stop functionality that automatically adjusts stop loss positions as prices move favorably, protecting existing profits.
-
Optimize Parameter Settings: Backtest different Bollinger Band periods (not limited to 20) and standard deviation multipliers (not limited to 2.0) to find parameter combinations more suitable for specific markets.
Summary
The Bollinger Bands Mean Reversion Trading Strategy is a simple yet effective quantitative trading method that leverages the market's mean reversion characteristics to capture price movements from oversold areas back to the mean. The strategy features clear entry, take profit, and stop loss conditions that are easy to implement and backtest. However, to enhance the strategy's robustness, it is recommended to introduce trend filtering, multiple timeframe analysis, and optimized money management measures. Traders should also recognize that changing market environments may affect strategy performance, making regular evaluation and adjustment of strategy parameters key to maintaining long-term profitability. With these optimizations, the Bollinger Bands Mean Reversion Strategy can become a powerful tool in a trader's arsenal, especially in volatile markets with mean reversion tendencies.
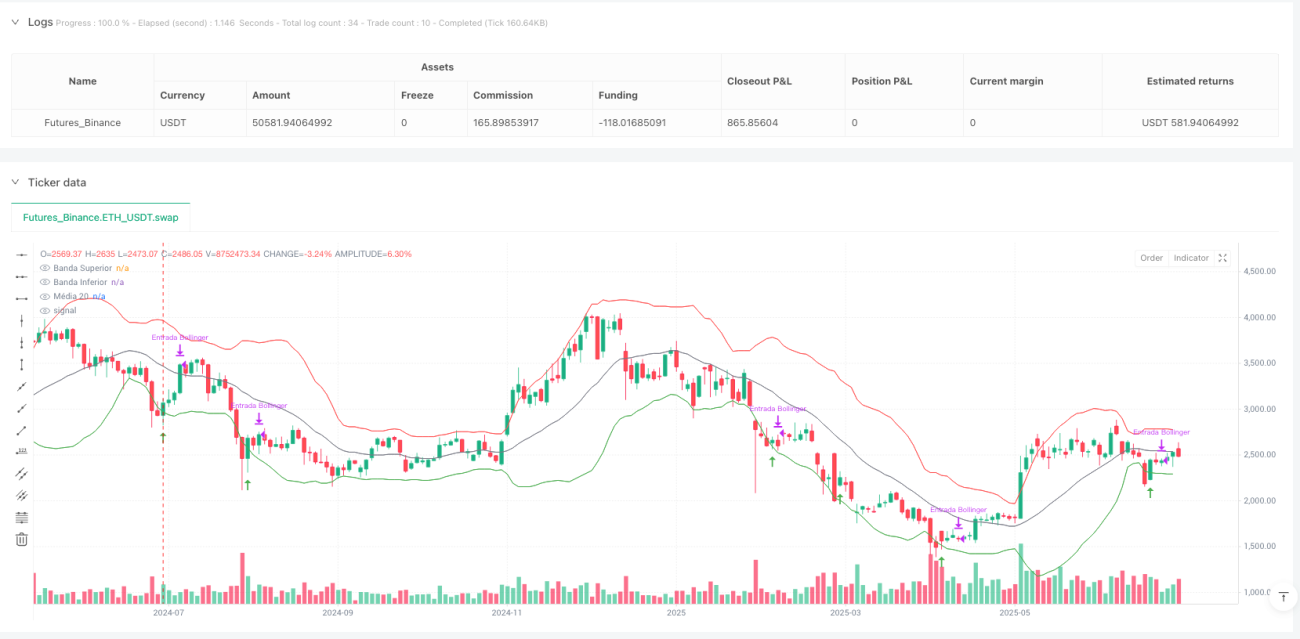
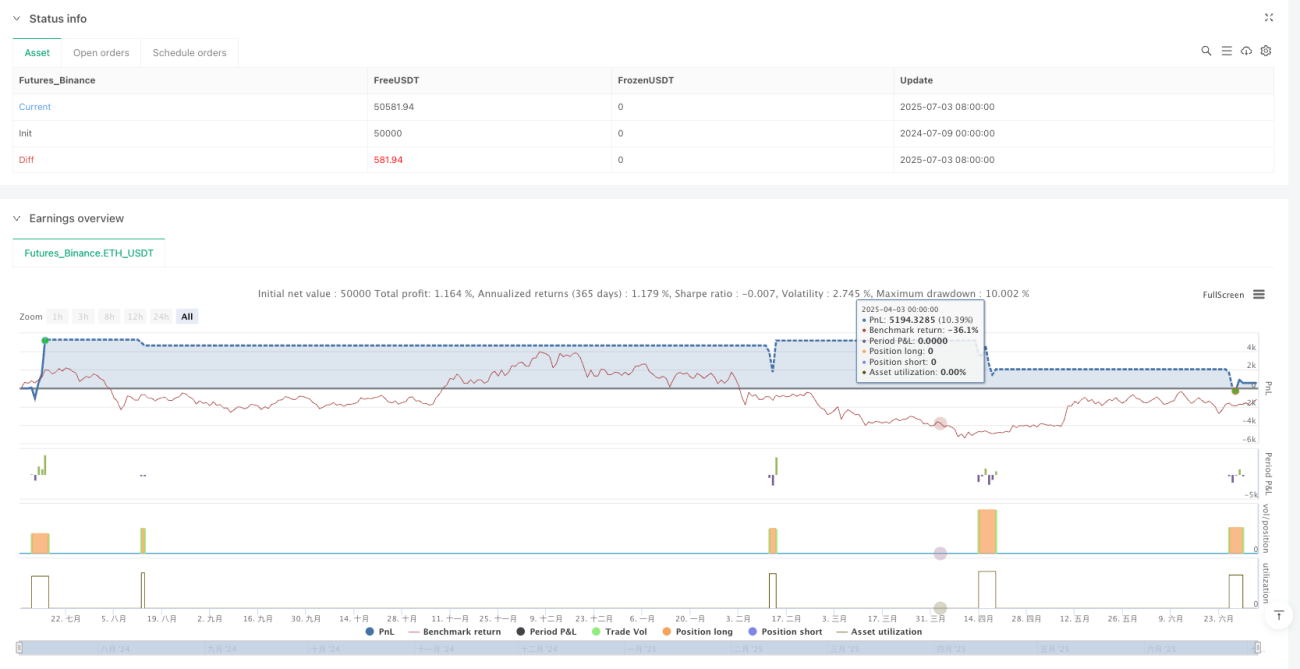
/*backtest
start: 2024-07-09 00:00:00
end: 2025-07-04 08:00:00
period: 2d
basePeriod: 2d
exchanges: [{"eid":"Futures_Binance","currency":"ETH_USDT"}]
*/

//@version=5
strategy("Bollinger Reversal | 100% Take at 20 MA", overlay=true,
     default_qty_type=strategy.percent_of_equity, default_qty_value=100,
initial_capital=1000, currency=currency.EUR)- 1