Volatility Deviation Moving Average Crossover Quantitative Strategy

Strategy Overview
The Volatility Deviation Moving Average Crossover Quantitative Strategy is an innovative trading system that transcends traditional price analysis methods by directly analyzing second-order volatility dynamics in the market. The strategy operates on the core principle that the most powerful trading signals come not just from price itself, but from the behavioral patterns of volatility. By analyzing the rate of change, momentum, and structure of market volatility, the strategy identifies periods of market expansion and contraction, providing a unique edge in anticipating major market moves.
At the heart of the strategy is the VoVix indicator, a normalized measure based on the Average True Range (ATR) that gauges volatility acceleration or deceleration. The system determines market state by analyzing the relationship between two DEVMA (Deviation Moving Average) lines and generates trading signals when these lines cross. This approach enables traders to predict changes in market state rather than merely reacting to price movements.
Strategy Principles
The Volatility Deviation Moving Average Crossover Quantitative Strategy is based on a series of sophisticated mathematical calculations designed to capture second-order properties of market volatility. Its core principles include:
-
VoVix Score Calculation: The strategy first calculates the VoVix Score, a normalized measure of volatility thrust.
- Mathematical formula: VoVix Score = (ATR(fast) - ATR(slow)) / (StDev(ATR(fast)) + ε)
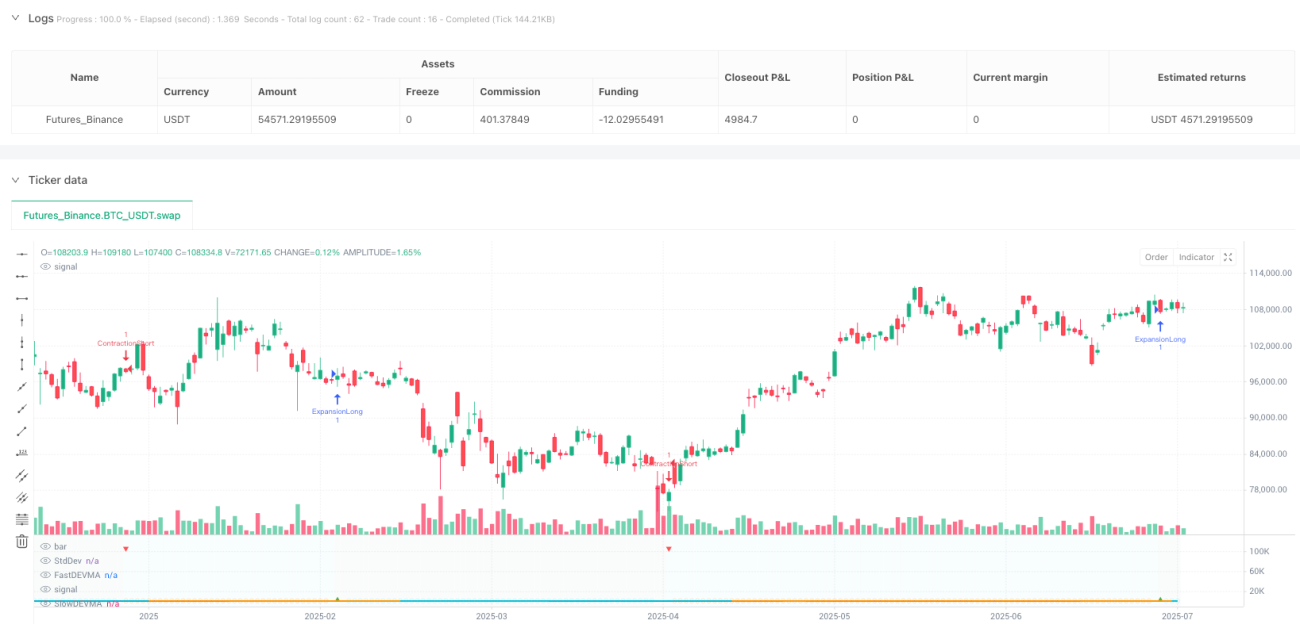
- When the fast ATR is significantly higher than the slow ATR, it indicates a rapid increase in volatility, the market is "expanding."
- When the fast ATR falls below the slow ATR, it indicates a decrease in volatility, the market is "contracting."
-
Deviation Analysis (DEV): The strategy calculates the standard deviation of the VoVix Score itself to gauge the chaos or stability in market volatility dynamics.
- Mathematical formula: DEV = StDev(VoVix Score, lookback_period)
- A high DEV value means volatility thrust is erratic and unpredictable.
- A low DEV value suggests the change in volatility is smooth and directional.
-
DEVMA Crossover: This is the primary signal generator. The strategy calculates two moving averages of the DEV value and generates trade signals when they cross.
- Mathematical formula: fastDEVMA = SMA(DEV, fast_period), slowDEVMA = SMA(DEV, slow_period)
- Bullish Crossover (fastDEVMA > slowDEVMA): Signals that short-term volatility chaos is increasing relative to the long-term measure, often preceding significant market expansion.
- Bearish Crossunder (fastDEVMA < slowDEVMA): Signals that short-term volatility chaos is decreasing, with the market settling down or contracting.
-
Adaptive Execution Mechanism: The system includes intelligent stop-loss, take-profit, and trailing stop mechanisms, all of which dynamically adjust based on ATR values to adapt to current market volatility.
Strategy Advantages
After a thorough analysis of the code, the following advantages can be summarized:
-
Predictive Rather Than Reactive: Unlike most traditional indicators that react to price changes, this strategy predicts changes in market state, giving traders a proactive edge.
-
High Adaptability: By using ATR-based exits, the strategy automatically adapts to the volatility of different market environments without manual parameter adjustments.
-
Market State Identification: The strategy clearly distinguishes between expansion and contraction market states, allowing traders to adjust their trading strategies according to the current market environment.
-
Robust Risk Management: By implementing smart stop-losses, dynamic take-profits, and trailing stops, the strategy effectively controls risk while capturing favorable moves.
-
Rich Visual Feedback: The strategy provides intuitive visual interfaces including flow lines, path boxes, and functional levels, helping traders better understand market state and signal strength.
-
Multi-Timeframe Adaptability: The design of the strategy allows it to operate effectively across various timeframes, making it suitable for both short and long-term trading.
-
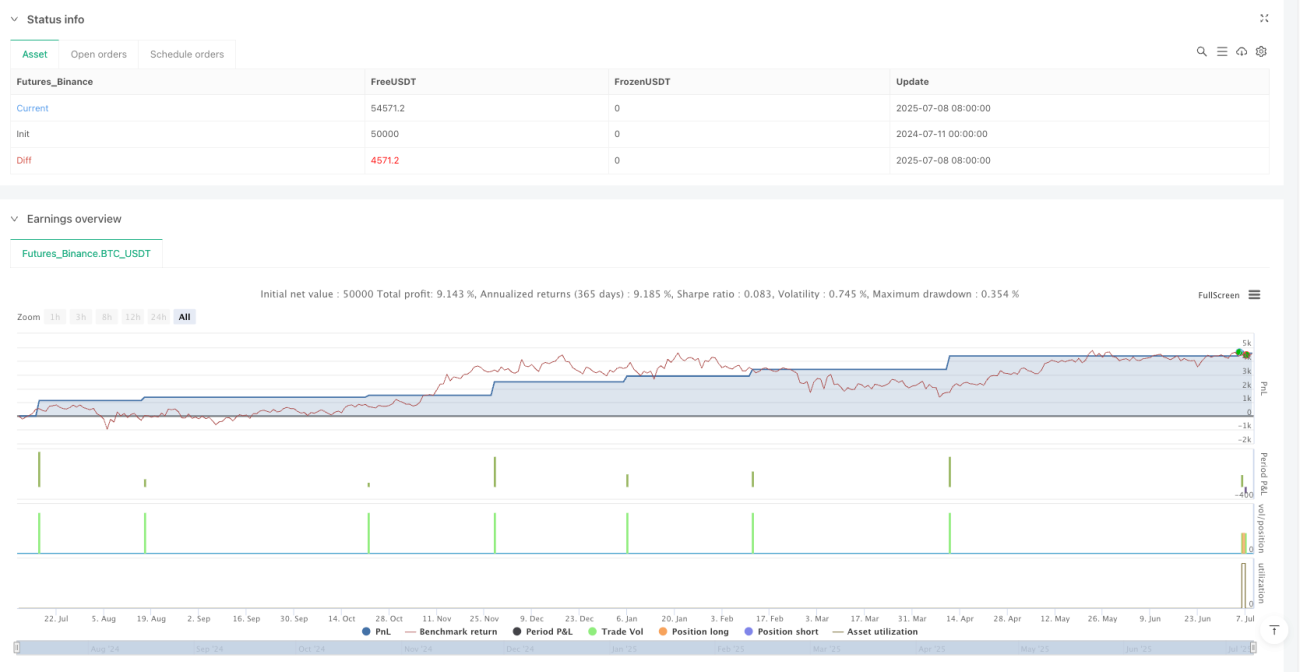
High Win Rate Potential: According to backtesting results, the strategy demonstrated a win rate of up to 84.09% with a profit factor of 2.663, indicating its potential to perform well under various market conditions.
Strategy Risks
Despite its significant advantages, the strategy also has some potential risks and limitations:
-
Parameter Dependency: The effectiveness of the strategy largely depends on the correct setting of DEVMA parameters, with different markets potentially requiring different parameter settings for optimal results.
-
Inconsistent Signal Frequency: Under certain market conditions, the strategy may generate too many or too few trading signals, affecting overall performance and trading frequency.
-
Drawdown Risk: Although the strategy implements risk management measures, it may still suffer significant drawdowns under extreme market conditions such as sudden high volatility or flash crash events.
-
Overfitting Risk: With multiple adjustable parameters, there is a risk of overfitting, which could lead to good backtesting performance but poor live trading results.
-
Computational Complexity: The strategy involves multi-layered mathematical calculations, which may be difficult for beginners to understand and modify, increasing the risk of misconfigurations.
-
Expectations Based on Historical Performance: The high win rate is derived from backtesting over a specific historical period and does not guarantee the same performance in the future.
-
Timeframe Specificity: Certain parameter settings may perform well on specific timeframes but poorly on others, requiring optimization for different timeframes.
Strategy Optimization Directions
Through deep analysis of the code, the following potential optimization directions have been identified:
-
Dynamic Parameter Adjustment: Implement automatic parameter optimization mechanisms that allow the strategy to adjust DEVMA lengths and other key parameters according to different market cycles and conditions. This will enhance the adaptability of the strategy and reduce the need for manual optimization.
-
Machine Learning Integration: Introduce machine learning algorithms to predict signal quality or market state, thereby enhancing the strategy's predictive capability. By training models with historical data, more accurate identification of potential high-probability trading opportunities is possible.
-
Multi-Factor Validation: Add auxiliary indicators or conditions to validate DEVMA crossover signals, reducing false signals and improving signal quality. For example, trend strength indicators or price pattern recognition could be combined to confirm signals.
-
Volatility Source Diversification: Experiment with different volatility calculation methods (such as Parkinson volatility, Garman-Klass volatility) instead of ATR, which may provide better results under certain market conditions.
-
Time Filter Enhancement: Improve the existing trading session management system by adding more sophisticated time filters, such as trading only during specific sessions under specific market conditions, avoiding inefficient periods.
-
Position Management Optimization: Implement a more advanced position management system that dynamically adjusts trade sizes based on signal strength, market state, and volatility levels.
-
Sequential Signal Analysis: Add functionality to analyze consecutive signals, identifying sequential patterns of high-quality signals to further improve the accuracy of trading decisions.
-
Multi-Timeframe Analysis: Integrate multi-timeframe analysis to ensure trading signals align with the market direction of larger timeframes, reducing the probability of counter-trend trades.
Summary
The Volatility Deviation Moving Average Crossover Quantitative Strategy is an innovative and comprehensive trading system that provides unique market insights by analyzing second-order dynamics of volatility rather than just focusing on price changes. The strategy is capable of identifying market expansion and contraction cycles, allowing traders to prepare for changes in market state before they occur.
By using normalized volatility calculations and moving average crossover techniques, the strategy creates a trading framework that is both robust and adaptive. The integrated risk management system, including ATR-based stop-losses, take-profits, and trailing stops, makes it a complete trading solution.
While the strategy has demonstrated good performance in backtesting, traders should be aware that any trading system has inherent risks, especially under extreme market conditions. It is advisable to conduct thorough backtesting and forward testing before live trading to validate the strategy's performance across various market conditions.
By implementing the suggested optimization measures, particularly dynamic parameter adjustment and multi-factor validation, traders can further enhance the performance and adaptability of the strategy, creating a more robust and effective trading system.
//@version=5
strategy("VoVix DEVMA Clean", shorttitle="VoVix", overlay=false)

//==============================================================================
// VoVix DEVMA Configuration
//==============================================================================
group_devma = "VoVix DEVMA Configuration"
devLen = input.int(59, "Deviation Lookback", minval=15, maxval=60, group=group_devma)
fastVoVixLen = input.int(20, "Fast VoVix Length", minval=10, maxval=50, group=group_devma)
slowVoVixLen = input.int(60, "Slow VoVix Length", minval=30, maxval=100, group=group_devma)

//==============================================================================- 1